
|
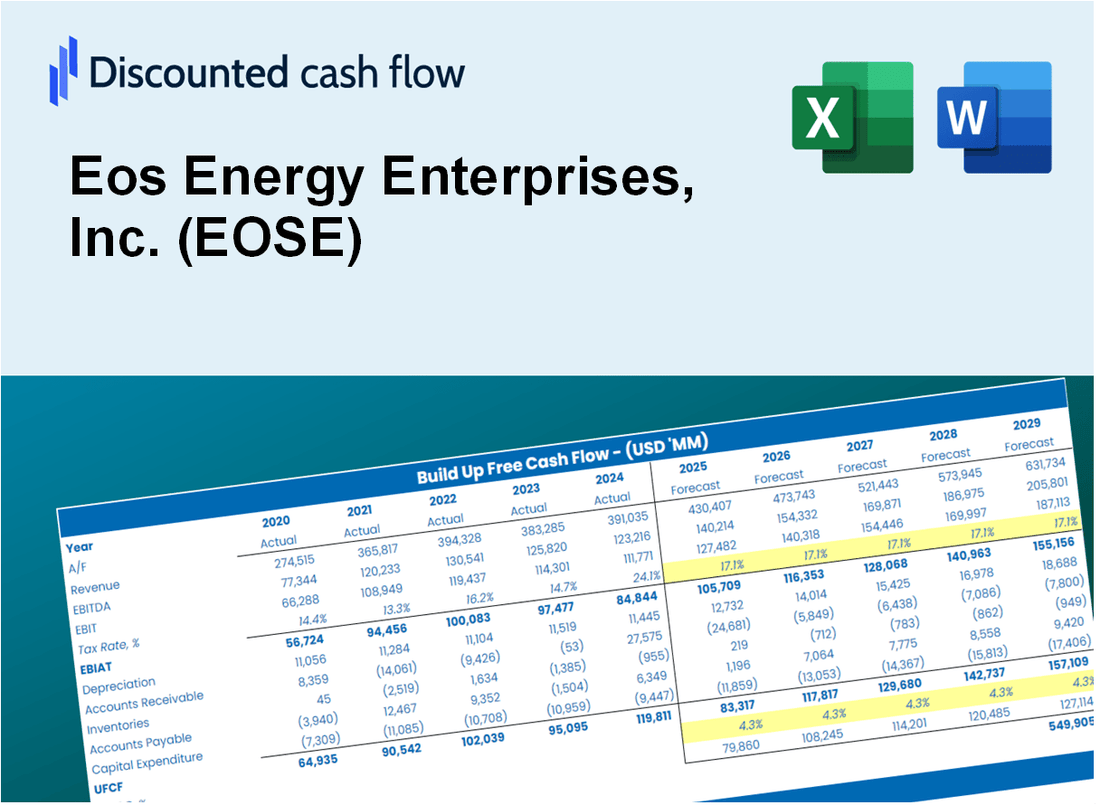
EOS Energy Enterprises ، Inc. (EOSE) DCF تقييم |
Fully Editable: Tailor To Your Needs In Excel Or Sheets
Professional Design: Trusted, Industry-Standard Templates
Investor-Approved Valuation Models
MAC/PC Compatible, Fully Unlocked
No Expertise Is Needed; Easy To Follow
Eos Energy Enterprises, Inc. (EOSE) Bundle
عزز استراتيجية الاستثمار الخاصة بك مع حاسبة EOS Energy Enterprises ، Inc. (EOSE) DCF! استكشاف البيانات المالية الأصلية لـ EOS ، وضبط توقعات النمو والنفقات ، ومراقبة على الفور كيف تؤثر هذه التعديلات على القيمة الجوهرية لـ EOS Energy Enterprises ، Inc. (EOSE).
What You Will Receive
- Pre-Filled Financial Model: Eos Energy's actual data allows for accurate DCF valuation.
- Comprehensive Forecast Control: Modify revenue growth, profit margins, WACC, and other essential metrics.
- Real-Time Calculations: Automatic updates provide immediate feedback as you make adjustments.
- Professional-Grade Template: A polished Excel file crafted for high-quality valuation.
- Flexible and Reusable: Designed for adaptability, enabling repeated use for in-depth forecasts.
Key Features
- Customizable Energy Metrics: Adjust essential inputs such as energy production forecasts, operational costs, and capital investments.
- Instant DCF Analysis: Quickly computes intrinsic value, NPV, and additional financial metrics.
- High-Precision Accuracy: Leverages Eos Energy’s actual financial data for dependable valuation results.
- Effortless Scenario Testing: Evaluate various assumptions and analyze results with ease.
- Efficiency Booster: Avoid the complexities of creating intricate valuation models from the ground up.
How It Works
- Step 1: Download the prebuilt Excel template with Eos Energy Enterprises, Inc.'s (EOSE) data included.
- Step 2: Explore the pre-filled sheets and familiarize yourself with the key metrics.
- Step 3: Update forecasts and assumptions in the editable yellow cells (WACC, growth, margins).
- Step 4: Instantly view recalculated results, including Eos Energy Enterprises, Inc.'s (EOSE) intrinsic value.
- Step 5: Make informed investment decisions or generate reports using the outputs.
Why Choose This Calculator for Eos Energy Enterprises, Inc. (EOSE)?
- Designed for Experts: A sophisticated tool utilized by energy analysts, CFOs, and industry consultants.
- Accurate Data: Eos Energy’s historical and projected financials are preloaded to ensure precision.
- Flexible Scenario Analysis: Easily simulate various forecasts and assumptions.
- Comprehensive Outputs: Automatically computes intrinsic value, NPV, and essential metrics.
- User-Friendly: Clear, step-by-step instructions make the process straightforward.
Who Should Use Eos Energy Enterprises, Inc. (EOSE)?
- Investors: Gain insights and make informed decisions with our advanced energy solutions.
- Energy Analysts: Streamline your evaluations with comprehensive data on renewable energy technologies.
- Consultants: Tailor our resources for effective client presentations or strategic reports.
- Energy Enthusiasts: Enhance your knowledge of sustainable energy practices through practical examples.
- Educators and Students: Utilize our materials as a hands-on resource in energy-related studies.
What the Template Contains
- Historical Data: Includes Eos Energy Enterprises, Inc.'s (EOSE) past financials and baseline forecasts.
- DCF and Levered DCF Models: Detailed templates to calculate Eos Energy's intrinsic value.
- WACC Sheet: Pre-built calculations for Weighted Average Cost of Capital.
- Editable Inputs: Modify key drivers like growth rates, EBITDA %, and CAPEX assumptions.
- Quarterly and Annual Statements: A complete breakdown of Eos Energy's financials.
- Interactive Dashboard: Visualize valuation results and projections dynamically.
Disclaimer
All information, articles, and product details provided on this website are for general informational and educational purposes only. We do not claim any ownership over, nor do we intend to infringe upon, any trademarks, copyrights, logos, brand names, or other intellectual property mentioned or depicted on this site. Such intellectual property remains the property of its respective owners, and any references here are made solely for identification or informational purposes, without implying any affiliation, endorsement, or partnership.
We make no representations or warranties, express or implied, regarding the accuracy, completeness, or suitability of any content or products presented. Nothing on this website should be construed as legal, tax, investment, financial, medical, or other professional advice. In addition, no part of this site—including articles or product references—constitutes a solicitation, recommendation, endorsement, advertisement, or offer to buy or sell any securities, franchises, or other financial instruments, particularly in jurisdictions where such activity would be unlawful.
All content is of a general nature and may not address the specific circumstances of any individual or entity. It is not a substitute for professional advice or services. Any actions you take based on the information provided here are strictly at your own risk. You accept full responsibility for any decisions or outcomes arising from your use of this website and agree to release us from any liability in connection with your use of, or reliance upon, the content or products found herein.