
|
Enerpac Tool Group Corp. (EPAC) تقييم DCF |
Fully Editable: Tailor To Your Needs In Excel Or Sheets
Professional Design: Trusted, Industry-Standard Templates
Investor-Approved Valuation Models
MAC/PC Compatible, Fully Unlocked
No Expertise Is Needed; Easy To Follow
Enerpac Tool Group Corp. (EPAC) Bundle
هل تبحث عن تقييم القيمة الجوهرية لمجموعة Enerpac Tool Group Corp ؟ تدمج حاسبة DCF (EPAC) الخاصة بنا بيانات العالم الحقيقي مع ميزات تخصيص واسعة النطاق، مما يتيح لك تحسين توقعاتك وتعزيز استراتيجيات الاستثمار الخاصة بك.
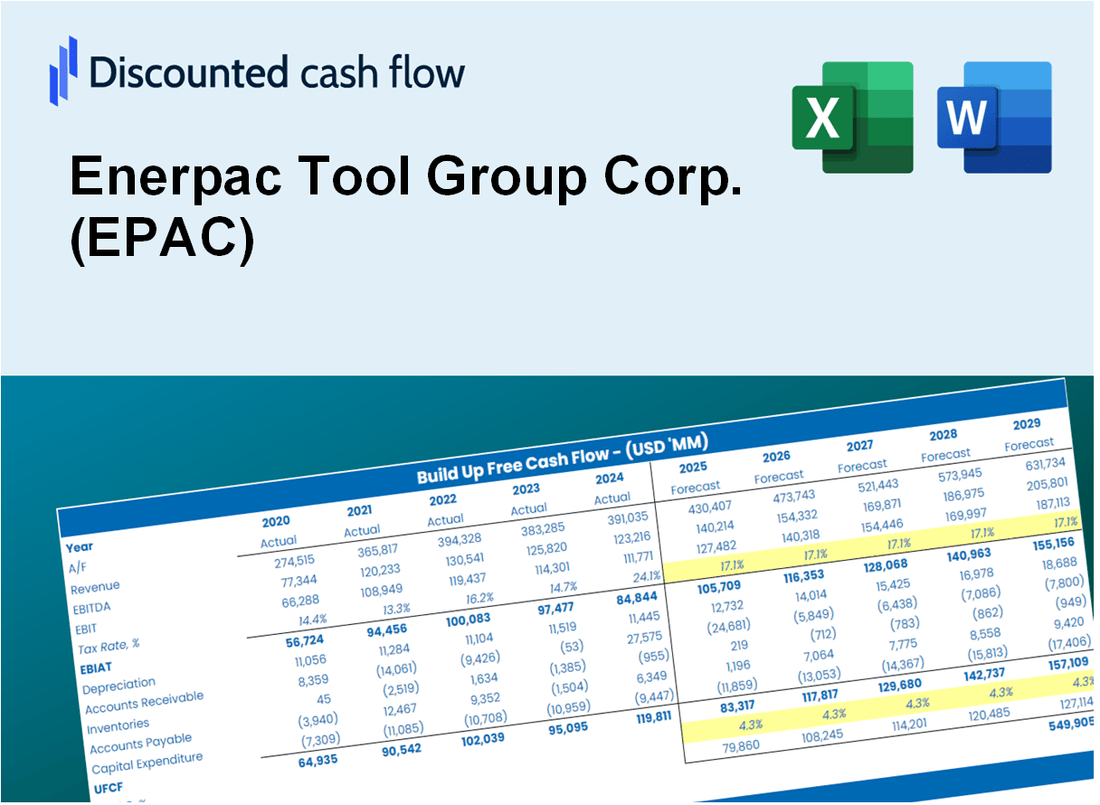
Discounted Cash Flow (DCF) - (USD MM)
| Year | AY1 2021 |
AY2 2022 |
AY3 2023 |
AY4 2024 |
AY5 2025 |
FY1 2026 |
FY2 2027 |
FY3 2028 |
FY4 2029 |
FY5 2030 |
|---|---|---|---|---|---|---|---|---|---|---|
| Revenue | 528.7 | 571.2 | 598.2 | 589.5 | 616.9 | 641.5 | 667.1 | 693.8 | 721.5 | 750.3 |
| Revenue Growth, % | 0 | 8.05 | 4.72 | -1.45 | 4.65 | 3.99 | 3.99 | 3.99 | 3.99 | 3.99 |
| EBITDA | 70.9 | 48.0 | 97.6 | 132.3 | 146.3 | 108.1 | 112.5 | 116.9 | 121.6 | 126.5 |
| EBITDA, % | 13.4 | 8.4 | 16.32 | 22.45 | 23.72 | 16.86 | 16.86 | 16.86 | 16.86 | 16.86 |
| Depreciation | 21.6 | 19.6 | 16.3 | 13.3 | 15.7 | 19.3 | 20.1 | 20.9 | 21.7 | 22.6 |
| Depreciation, % | 4.09 | 3.43 | 2.73 | 2.25 | 2.54 | 3.01 | 3.01 | 3.01 | 3.01 | 3.01 |
| EBIT | 49.2 | 28.4 | 81.3 | 119.0 | 130.6 | 88.8 | 92.4 | 96.1 | 99.9 | 103.9 |
| EBIT, % | 9.31 | 4.97 | 13.59 | 20.19 | 21.18 | 13.85 | 13.85 | 13.85 | 13.85 | 13.85 |
| Total Cash | 140.4 | 120.7 | 154.4 | 167.1 | 151.6 | 162.2 | 168.7 | 175.4 | 182.4 | 189.7 |
| Total Cash, percent | .0 | .0 | .0 | .0 | .0 | .0 | .0 | .0 | .0 | .0 |
| Account Receivables | 103.2 | 106.7 | 97.6 | 104.3 | 106.1 | 114.7 | 119.3 | 124.1 | 129.0 | 134.2 |
| Account Receivables, % | 19.53 | 18.69 | 16.32 | 17.7 | 17.2 | 17.89 | 17.89 | 17.89 | 17.89 | 17.89 |
| Inventories | 75.3 | 83.7 | 74.8 | 72.9 | 78.8 | 85.4 | 88.8 | 92.3 | 96.0 | 99.8 |
| Inventories, % | 14.25 | 14.65 | 12.5 | 12.36 | 12.77 | 13.31 | 13.31 | 13.31 | 13.31 | 13.31 |
| Accounts Payable | 62.0 | 72.5 | 50.5 | 43.4 | 42.9 | 60.5 | 62.9 | 65.5 | 68.1 | 70.8 |
| Accounts Payable, % | 11.72 | 12.7 | 8.44 | 7.36 | 6.96 | 9.43 | 9.43 | 9.43 | 9.43 | 9.43 |
| Capital Expenditure | -12.0 | -8.4 | -9.4 | -11.4 | -19.3 | -13.3 | -13.9 | -14.4 | -15.0 | -15.6 |
| Capital Expenditure, % | -2.27 | -1.47 | -1.57 | -1.94 | -3.14 | -2.08 | -2.08 | -2.08 | -2.08 | -2.08 |
| Tax Rate, % | 23.18 | 23.18 | 23.18 | 23.18 | 23.18 | 23.18 | 23.18 | 23.18 | 23.18 | 23.18 |
| EBITAT | 42.6 | 18.6 | 54.9 | 96.7 | 100.4 | 67.1 | 69.8 | 72.6 | 75.5 | 78.5 |
| Depreciation | ||||||||||
| Changes in Account Receivables | ||||||||||
| Changes in Inventories | ||||||||||
| Changes in Accounts Payable | ||||||||||
| Capital Expenditure | ||||||||||
| UFCF | -64.4 | 28.5 | 57.8 | 86.7 | 88.6 | 75.4 | 70.4 | 73.2 | 76.1 | 79.2 |
| WACC, % | 8.11 | 8.02 | 8.03 | 8.09 | 8.07 | 8.07 | 8.07 | 8.07 | 8.07 | 8.07 |
| PV UFCF | ||||||||||
| SUM PV UFCF | 297.6 | |||||||||
| Long Term Growth Rate, % | 4.00 | |||||||||
| Free cash flow (T + 1) | 82 | |||||||||
| Terminal Value | 2,025 | |||||||||
| Present Terminal Value | 1,374 | |||||||||
| Enterprise Value | 1,672 | |||||||||
| Net Debt | 38 | |||||||||
| Equity Value | 1,634 | |||||||||
| Diluted Shares Outstanding, MM | 54 | |||||||||
| Equity Value Per Share | 29.98 |
What You Will Get
- Real EPAC Financials: Access historical and projected data for precise valuation.
- Customizable Inputs: Adjust WACC, tax rates, revenue growth, and capital expenditures as needed.
- Dynamic Calculations: Intrinsic value and NPV are computed in real-time.
- Scenario Analysis: Explore various scenarios to assess Enerpac Tool Group Corp.'s future performance.
- User-Friendly Design: Designed for professionals while remaining approachable for newcomers.
Key Features
- Comprehensive Historical Data: Enerpac Tool Group Corp.'s (EPAC) historical financial statements and pre-filled forecasts.
- Customizable Parameters: Modify WACC, tax rates, revenue growth, and EBITDA margins to fit your analysis.
- Real-Time Valuation: Watch the intrinsic value of Enerpac Tool Group Corp. (EPAC) update instantly.
- Informative Visual Representations: Dashboard charts illustrate valuation results and essential metrics clearly.
- Designed for Precision: A reliable tool tailored for analysts, investors, and finance professionals.
How It Works
- Download the Template: Gain immediate access to the Excel-based EPAC DCF Calculator.
- Input Your Assumptions: Modify the yellow-highlighted cells for growth rates, WACC, margins, and other key metrics.
- Instant Calculations: The model will automatically refresh Enerpac Tool Group's intrinsic value.
- Test Scenarios: Experiment with various assumptions to assess potential changes in valuation.
- Analyze and Decide: Leverage the outcomes to inform your investment or financial analysis.
Why Choose This Calculator for Enerpac Tool Group Corp. (EPAC)?
- All-in-One Solution: Integrates DCF, WACC, and financial ratio evaluations tailored for Enerpac.
- Flexible Inputs: Modify the highlighted cells to explore different financial scenarios.
- In-Depth Analysis: Automatically computes Enerpac’s intrinsic value and Net Present Value.
- Preloaded Information: Access historical and projected data for precise analysis.
- High-Quality Standards: Perfect for financial analysts, investors, and business advisors focusing on Enerpac.
Who Should Use Enerpac Tool Group Corp. (EPAC)?
- Investors: Make informed investment choices with comprehensive insights into Enerpac's market performance.
- Financial Analysts: Utilize detailed financial reports and analysis tools for precise evaluations of Enerpac's financial health.
- Consultants: Tailor analysis and presentations using Enerpac's data to meet client needs effectively.
- Industry Enthusiasts: Enhance your knowledge of the tool and equipment sector with Enerpac's innovative solutions.
- Educators and Students: Leverage Enerpac's case studies for practical applications in engineering and business courses.
What the Template Contains
- Pre-Filled Data: Includes Enerpac Tool Group Corp.’s historical financials and forecasts.
- Discounted Cash Flow Model: Editable DCF valuation model with automatic calculations.
- Weighted Average Cost of Capital (WACC): A dedicated sheet for calculating WACC based on custom inputs.
- Key Financial Ratios: Analyze Enerpac Tool Group Corp.’s profitability, efficiency, and leverage.
- Customizable Inputs: Edit revenue growth, margins, and tax rates with ease.
- Clear Dashboard: Charts and tables summarizing key valuation results.
Disclaimer
All information, articles, and product details provided on this website are for general informational and educational purposes only. We do not claim any ownership over, nor do we intend to infringe upon, any trademarks, copyrights, logos, brand names, or other intellectual property mentioned or depicted on this site. Such intellectual property remains the property of its respective owners, and any references here are made solely for identification or informational purposes, without implying any affiliation, endorsement, or partnership.
We make no representations or warranties, express or implied, regarding the accuracy, completeness, or suitability of any content or products presented. Nothing on this website should be construed as legal, tax, investment, financial, medical, or other professional advice. In addition, no part of this site—including articles or product references—constitutes a solicitation, recommendation, endorsement, advertisement, or offer to buy or sell any securities, franchises, or other financial instruments, particularly in jurisdictions where such activity would be unlawful.
All content is of a general nature and may not address the specific circumstances of any individual or entity. It is not a substitute for professional advice or services. Any actions you take based on the information provided here are strictly at your own risk. You accept full responsibility for any decisions or outcomes arising from your use of this website and agree to release us from any liability in connection with your use of, or reliance upon, the content or products found herein.