
|
Esperion Therapeutics ، Inc. (ESPR) تقييم DCF |
Fully Editable: Tailor To Your Needs In Excel Or Sheets
Professional Design: Trusted, Industry-Standard Templates
Investor-Approved Valuation Models
MAC/PC Compatible, Fully Unlocked
No Expertise Is Needed; Easy To Follow
Esperion Therapeutics, Inc. (ESPR) Bundle
تقييم التوقعات المالية لشركة Esperion Therapeutics مع الخبرة! توفر حاسبة DCF (ESPR) هذه البيانات المالية المليئة مسبقًا جنبًا إلى جنب مع المرونة الكاملة لتعديل نمو الإيرادات ، WACC ، الهوامش ، وغيرها من الافتراضات الأساسية التي تتماشى مع تنبؤاتك.
What You Will Get
- Real Esperion Data: Preloaded financials – from revenue to EBIT – based on actual and projected figures for Esperion Therapeutics, Inc. (ESPR).
- Full Customization: Adjust all critical parameters (yellow cells) like WACC, growth %, and tax rates specific to Esperion.
- Instant Valuation Updates: Automatic recalculations to analyze the impact of changes on Esperion’s fair value.
- Versatile Excel Template: Tailored for quick edits, scenario testing, and detailed projections for Esperion Therapeutics, Inc. (ESPR).
- Time-Saving and Accurate: Skip building models from scratch while maintaining precision and flexibility in your analysis of Esperion.
Key Features
- 🔍 Real-Life ESPR Financials: Pre-filled historical and projected data for Esperion Therapeutics, Inc.
- ✏️ Fully Customizable Inputs: Adjust all critical parameters (yellow cells) like WACC, growth %, and tax rates.
- 📊 Professional DCF Valuation: Built-in formulas calculate Esperion’s intrinsic value using the Discounted Cash Flow method.
- ⚡ Instant Results: Visualize Esperion’s valuation instantly after making changes.
- Scenario Analysis: Test and compare outcomes for various financial assumptions side-by-side.
How It Works
- Download the Template: Gain immediate access to the Excel-based ESPR DCF Calculator.
- Input Your Assumptions: Modify the yellow-highlighted cells for growth rates, WACC, margins, and other variables.
- Instant Calculations: The model automatically recalculates Esperion’s intrinsic value.
- Test Scenarios: Experiment with different assumptions to assess potential changes in valuation.
- Analyze and Decide: Utilize the results to inform your investment or financial strategy.
Why Choose Esperion Therapeutics, Inc. (ESPR)?
- Innovative Solutions: Cutting-edge therapies designed to address unmet medical needs.
- Proven Efficacy: Clinical trials demonstrate the effectiveness of our treatments in improving patient outcomes.
- Patient-Centric Approach: Focused on developing therapies that enhance the quality of life for patients.
- Strong Scientific Foundation: Backed by robust research and development efforts from leading experts in the field.
- Commitment to Accessibility: Striving to make our therapies available to those who need them most.
Who Should Use This Product?
- Individual Investors: Make informed decisions about buying or selling Esperion Therapeutics, Inc. (ESPR) stock.
- Financial Analysts: Streamline valuation processes with ready-to-use financial models for Esperion Therapeutics, Inc. (ESPR).
- Consultants: Deliver professional valuation insights on Esperion Therapeutics, Inc. (ESPR) to clients quickly and accurately.
- Business Owners: Understand how biotech companies like Esperion Therapeutics, Inc. (ESPR) are valued to guide your own strategy.
- Finance Students: Learn valuation techniques using real-world data and scenarios involving Esperion Therapeutics, Inc. (ESPR).
What the Template Contains
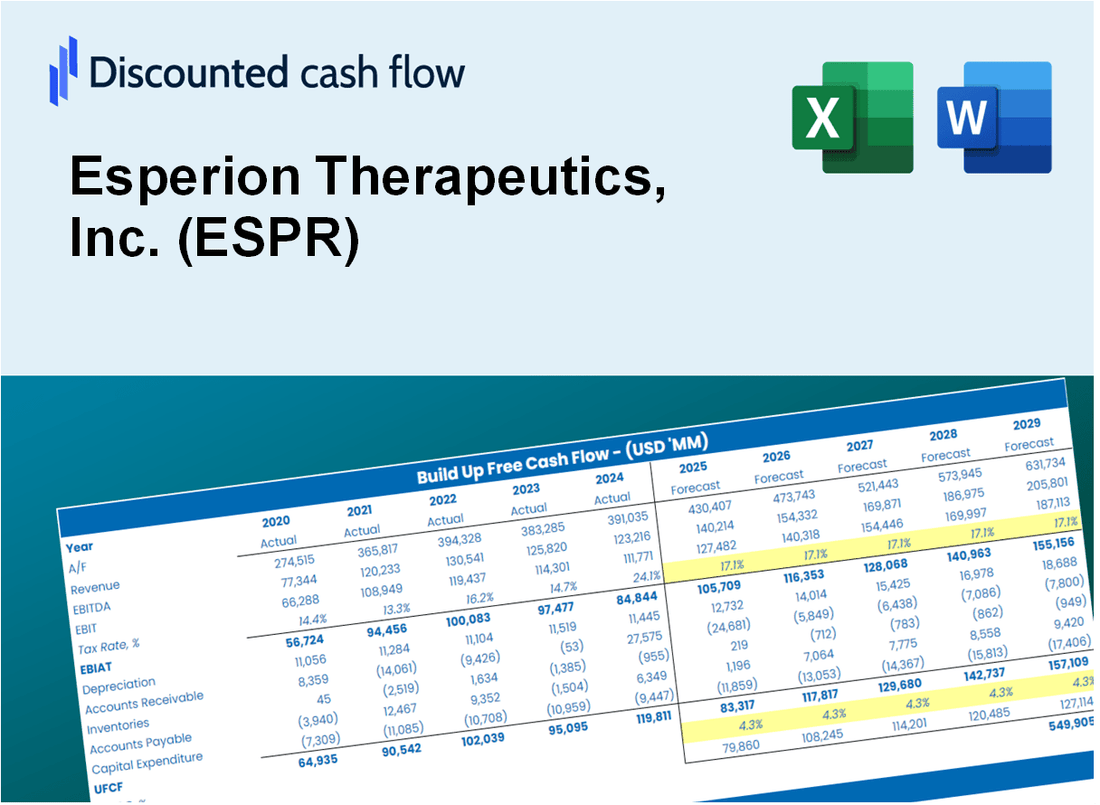
- Operating and Balance Sheet Data: Pre-filled Esperion Therapeutics historical data and forecasts, including revenue, EBITDA, EBIT, and capital expenditures.
- WACC Calculation: A dedicated sheet for Weighted Average Cost of Capital (WACC), including parameters like Beta, risk-free rate, and share price.
- DCF Valuation (Unlevered and Levered): Editable Discounted Cash Flow models showing intrinsic value with detailed calculations.
- Financial Statements: Pre-loaded financial statements (annual and quarterly) to support analysis.
- Key Ratios: Includes profitability, leverage, and efficiency ratios for Esperion Therapeutics, Inc. (ESPR).
- Dashboard and Charts: Visual summary of valuation outputs and assumptions to analyze results easily.
Disclaimer
All information, articles, and product details provided on this website are for general informational and educational purposes only. We do not claim any ownership over, nor do we intend to infringe upon, any trademarks, copyrights, logos, brand names, or other intellectual property mentioned or depicted on this site. Such intellectual property remains the property of its respective owners, and any references here are made solely for identification or informational purposes, without implying any affiliation, endorsement, or partnership.
We make no representations or warranties, express or implied, regarding the accuracy, completeness, or suitability of any content or products presented. Nothing on this website should be construed as legal, tax, investment, financial, medical, or other professional advice. In addition, no part of this site—including articles or product references—constitutes a solicitation, recommendation, endorsement, advertisement, or offer to buy or sell any securities, franchises, or other financial instruments, particularly in jurisdictions where such activity would be unlawful.
All content is of a general nature and may not address the specific circumstances of any individual or entity. It is not a substitute for professional advice or services. Any actions you take based on the information provided here are strictly at your own risk. You accept full responsibility for any decisions or outcomes arising from your use of this website and agree to release us from any liability in connection with your use of, or reliance upon, the content or products found herein.