
|
Fastenal Company (Fast) DCF تقييم |
Fully Editable: Tailor To Your Needs In Excel Or Sheets
Professional Design: Trusted, Industry-Standard Templates
Investor-Approved Valuation Models
MAC/PC Compatible, Fully Unlocked
No Expertise Is Needed; Easy To Follow
Fastenal Company (FAST) Bundle
اكتشف القيمة الحقيقية لشركة Fastenal (FAST) مع حاسبة DCF المتقدمة! اضبط الافتراضات الرئيسية ، واستكشف السيناريوهات المختلفة ، وقم بتقييم كيفية تأثير التغييرات على تقييم شركة Fastenal (FAST) - كل ذلك ضمن قالب Excel واحد.
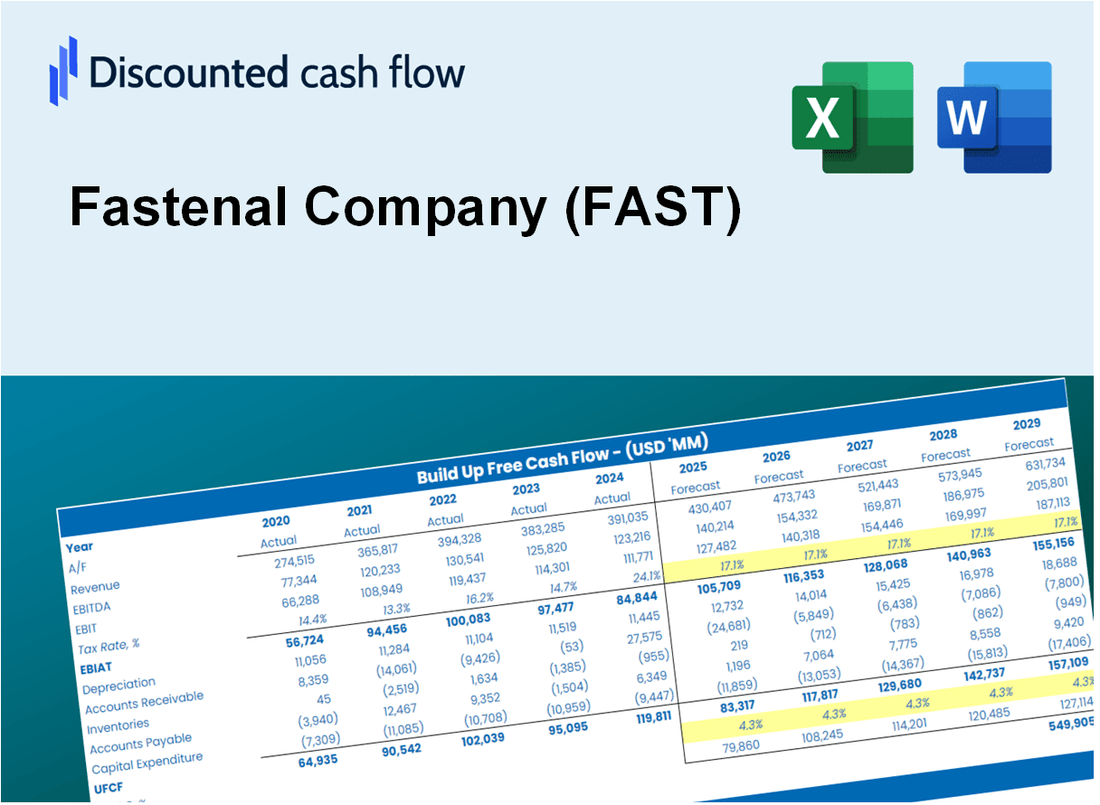
Discounted Cash Flow (DCF) - (USD MM)
| Year | AY1 2020 |
AY2 2021 |
AY3 2022 |
AY4 2023 |
AY5 2024 |
FY1 2025 |
FY2 2026 |
FY3 2027 |
FY4 2028 |
FY5 2029 |
|---|---|---|---|---|---|---|---|---|---|---|
| Revenue | 5,647.3 | 6,010.9 | 6,980.6 | 7,346.7 | 7,546.0 | 8,121.9 | 8,741.8 | 9,409.0 | 10,127.1 | 10,900.0 |
| Revenue Growth, % | 0 | 6.44 | 16.13 | 5.24 | 2.71 | 7.63 | 7.63 | 7.63 | 7.63 | 7.63 |
| EBITDA | 1,304.8 | 1,388.2 | 1,630.9 | 1,706.0 | 1,690.8 | 1,871.1 | 2,013.9 | 2,167.6 | 2,333.1 | 2,511.1 |
| EBITDA, % | 23.1 | 23.09 | 23.36 | 23.22 | 22.41 | 23.04 | 23.04 | 23.04 | 23.04 | 23.04 |
| Depreciation | 162.4 | 170.7 | 176.6 | 177.3 | 175.4 | 210.9 | 227.0 | 244.3 | 263.0 | 283.0 |
| Depreciation, % | 2.88 | 2.84 | 2.53 | 2.41 | 2.32 | 2.6 | 2.6 | 2.6 | 2.6 | 2.6 |
| EBIT | 1,142.4 | 1,217.5 | 1,454.3 | 1,528.7 | 1,515.4 | 1,660.2 | 1,787.0 | 1,923.3 | 2,070.1 | 2,228.1 |
| EBIT, % | 20.23 | 20.25 | 20.83 | 20.81 | 20.08 | 20.44 | 20.44 | 20.44 | 20.44 | 20.44 |
| Total Cash | 245.7 | 236.2 | 230.1 | 221.3 | 255.8 | 292.0 | 314.3 | 338.3 | 364.1 | 391.9 |
| Total Cash, percent | .0 | .0 | .0 | .0 | .0 | .0 | .0 | .0 | .0 | .0 |
| Account Receivables | 769.4 | 900.2 | 1,013.2 | 1,087.6 | 1,108.6 | 1,179.5 | 1,269.5 | 1,366.4 | 1,470.7 | 1,582.9 |
| Account Receivables, % | 13.62 | 14.98 | 14.51 | 14.8 | 14.69 | 14.52 | 14.52 | 14.52 | 14.52 | 14.52 |
| Inventories | 1,337.5 | 1,523.6 | 1,708.0 | 1,522.7 | 1,645.0 | 1,884.7 | 2,028.5 | 2,183.3 | 2,350.0 | 2,529.3 |
| Inventories, % | 23.68 | 25.35 | 24.47 | 20.73 | 21.8 | 23.2 | 23.2 | 23.2 | 23.2 | 23.2 |
| Accounts Payable | 207.0 | 233.1 | 255.0 | 264.1 | 287.7 | 302.2 | 325.3 | 350.1 | 376.8 | 405.6 |
| Accounts Payable, % | 3.67 | 3.88 | 3.65 | 3.59 | 3.81 | 3.72 | 3.72 | 3.72 | 3.72 | 3.72 |
| Capital Expenditure | -168.1 | -156.6 | -173.8 | -172.8 | -226.5 | -218.1 | -234.7 | -252.6 | -271.9 | -292.7 |
| Capital Expenditure, % | -2.98 | -2.61 | -2.49 | -2.35 | -3 | -2.69 | -2.69 | -2.69 | -2.69 | -2.69 |
| Tax Rate, % | 23.71 | 23.71 | 23.71 | 23.71 | 23.71 | 23.71 | 23.71 | 23.71 | 23.71 | 23.71 |
| EBITAT | 866.5 | 932.4 | 1,097.7 | 1,160.1 | 1,156.2 | 1,262.1 | 1,358.4 | 1,462.1 | 1,573.7 | 1,693.8 |
| Depreciation | ||||||||||
| Changes in Account Receivables | ||||||||||
| Changes in Inventories | ||||||||||
| Changes in Accounts Payable | ||||||||||
| Capital Expenditure | ||||||||||
| UFCF | -1,039.1 | 655.7 | 825.0 | 1,284.6 | 985.4 | 958.9 | 1,139.9 | 1,226.9 | 1,320.5 | 1,421.3 |
| WACC, % | 7.97 | 7.97 | 7.97 | 7.97 | 7.97 | 7.97 | 7.97 | 7.97 | 7.97 | 7.97 |
| PV UFCF | ||||||||||
| SUM PV UFCF | 4,780.4 | |||||||||
| Long Term Growth Rate, % | 4.00 | |||||||||
| Free cash flow (T + 1) | 1,478 | |||||||||
| Terminal Value | 37,190 | |||||||||
| Present Terminal Value | 25,341 | |||||||||
| Enterprise Value | 30,121 | |||||||||
| Net Debt | 230 | |||||||||
| Equity Value | 29,892 | |||||||||
| Diluted Shares Outstanding, MM | 1,149 | |||||||||
| Equity Value Per Share | 26.03 |
What You Will Get
- Real FAST Financials: Access to historical and projected data for precise valuation.
- Customizable Inputs: Adjust WACC, tax rates, revenue growth, and capital expenditures as needed.
- Dynamic Calculations: Intrinsic value and NPV are computed in real-time.
- Scenario Analysis: Explore various scenarios to assess Fastenal’s future performance.
- User-Friendly Design: Designed for professionals while remaining approachable for newcomers.
Key Features
- Pre-Loaded Data: Fastenal Company's historical financial statements and pre-filled forecasts.
- Fully Adjustable Inputs: Modify WACC, tax rates, revenue growth, and EBITDA margins as needed.
- Instant Results: Observe Fastenal's intrinsic value recalculating in real time.
- Clear Visual Outputs: Dashboard charts illustrate valuation results and essential metrics.
- Built for Accuracy: A professional tool designed for analysts, investors, and finance professionals.
How It Works
- Download the Template: Gain immediate access to the Excel-based FAST DCF Calculator.
- Input Your Assumptions: Modify the yellow-highlighted cells for growth rates, WACC, margins, and more.
- Instant Calculations: The model automatically recalculates Fastenal's intrinsic value.
- Test Scenarios: Experiment with different assumptions to assess potential valuation shifts.
- Analyze and Decide: Utilize the outcomes to inform your investment or financial analysis.
Why Choose This Calculator for Fastenal Company (FAST)?
- Accurate Data: Utilize real Fastenal financials for dependable valuation outcomes.
- Customizable: Modify essential parameters such as growth rates, WACC, and tax rates to align with your forecasts.
- Time-Saving: Ready-made calculations remove the hassle of starting from scratch.
- Professional-Grade Tool: Tailored for investors, analysts, and consultants in the field.
- User-Friendly: Easy-to-navigate design and comprehensive instructions ensure accessibility for all users.
Who Should Use This Product?
- Investors: Accurately assess Fastenal's (FAST) fair value prior to making investment choices.
- CFOs: Utilize a high-quality DCF model for financial reporting and strategic analysis.
- Consultants: Efficiently modify the template for client valuation reports.
- Entrepreneurs: Acquire knowledge about financial modeling practices employed by leading companies.
- Educators: Implement it as a resource to teach valuation techniques.
What the Template Contains
- Pre-Filled Data: Includes Fastenal Company's historical financials and projections.
- Discounted Cash Flow Model: Editable DCF valuation model featuring automatic calculations.
- Weighted Average Cost of Capital (WACC): A dedicated sheet for calculating WACC based on user-defined inputs.
- Key Financial Ratios: Evaluate Fastenal's profitability, efficiency, and leverage metrics.
- Customizable Inputs: Easily modify revenue growth, profit margins, and tax rates.
- Clear Dashboard: Visual representations and tables summarizing essential valuation findings.
Disclaimer
All information, articles, and product details provided on this website are for general informational and educational purposes only. We do not claim any ownership over, nor do we intend to infringe upon, any trademarks, copyrights, logos, brand names, or other intellectual property mentioned or depicted on this site. Such intellectual property remains the property of its respective owners, and any references here are made solely for identification or informational purposes, without implying any affiliation, endorsement, or partnership.
We make no representations or warranties, express or implied, regarding the accuracy, completeness, or suitability of any content or products presented. Nothing on this website should be construed as legal, tax, investment, financial, medical, or other professional advice. In addition, no part of this site—including articles or product references—constitutes a solicitation, recommendation, endorsement, advertisement, or offer to buy or sell any securities, franchises, or other financial instruments, particularly in jurisdictions where such activity would be unlawful.
All content is of a general nature and may not address the specific circumstances of any individual or entity. It is not a substitute for professional advice or services. Any actions you take based on the information provided here are strictly at your own risk. You accept full responsibility for any decisions or outcomes arising from your use of this website and agree to release us from any liability in connection with your use of, or reliance upon, the content or products found herein.