
|
Franklin BSP Realty Trust ، Inc. (FBRT) DCF تقييم |
Fully Editable: Tailor To Your Needs In Excel Or Sheets
Professional Design: Trusted, Industry-Standard Templates
Investor-Approved Valuation Models
MAC/PC Compatible, Fully Unlocked
No Expertise Is Needed; Easy To Follow
Franklin BSP Realty Trust, Inc. (FBRT) Bundle
استكشف المستقبل المالي لـ Franklin BSP Realty Trust ، Inc. (FBRT) مع حاسبة DCF سهلة الاستخدام! أدخل افتراضاتك للنمو والهوامش والتكاليف لحساب القيمة الجوهرية لـ Franklin BSP Realty Trust ، Inc. (FBRT) وتعزيز استراتيجية الاستثمار الخاصة بك.
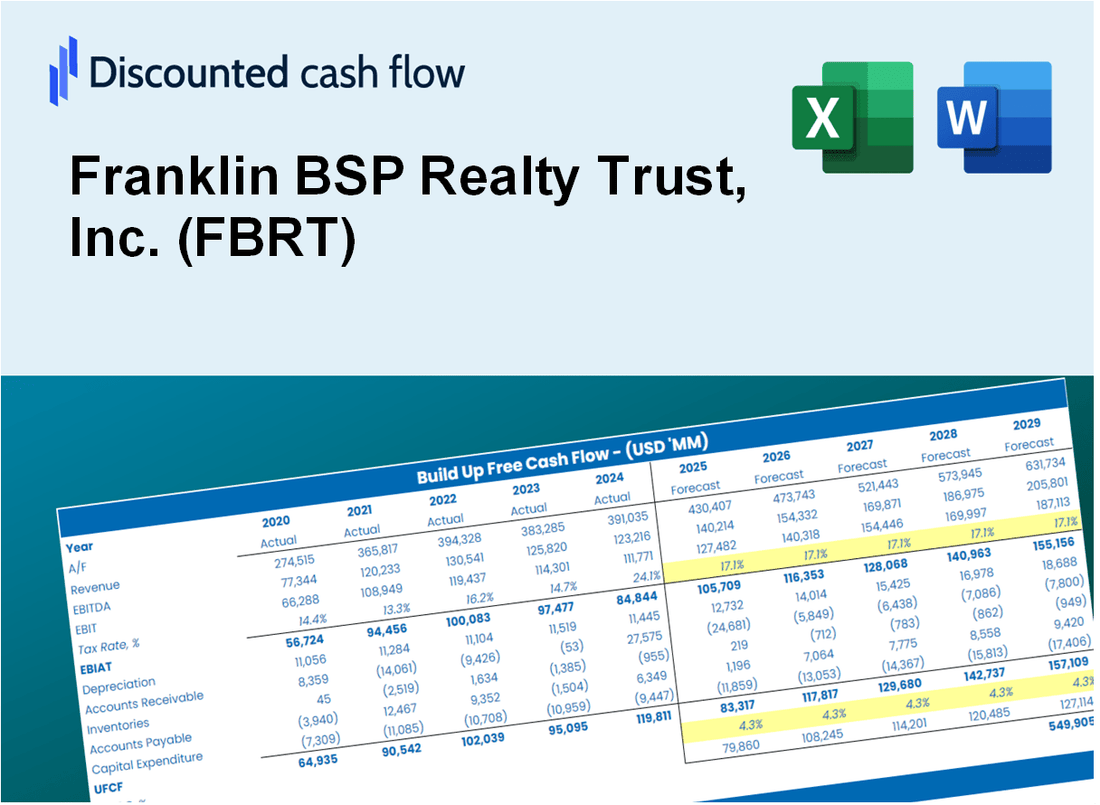
Discounted Cash Flow (DCF) - (USD MM)
| Year | AY1 2020 |
AY2 2021 |
AY3 2022 |
AY4 2023 |
AY5 2024 |
FY1 2025 |
FY2 2026 |
FY3 2027 |
FY4 2028 |
FY5 2029 |
|---|---|---|---|---|---|---|---|---|---|---|
| Revenue | 184.2 | 221.6 | 367.4 | 230.8 | 548.9 | 753.3 | 1,033.7 | 1,418.6 | 1,946.7 | 2,671.4 |
| Revenue Growth, % | 0 | 20.35 | 65.74 | -37.17 | 137.84 | 37.23 | 37.23 | 37.23 | 37.23 | 37.23 |
| EBITDA | 64.6 | 167.1 | 106.5 | 163.2 | 437.6 | 436.7 | 599.3 | 822.4 | 1,128.6 | 1,548.7 |
| EBITDA, % | 35.06 | 75.38 | 29 | 70.7 | 79.72 | 57.97 | 57.97 | 57.97 | 57.97 | 57.97 |
| Depreciation | 63.5 | 41.6 | 130.0 | 8.4 | 5.6 | 140.6 | 192.9 | 264.7 | 363.3 | 498.6 |
| Depreciation, % | 34.49 | 18.77 | 35.38 | 3.64 | 1.03 | 18.66 | 18.66 | 18.66 | 18.66 | 18.66 |
| EBIT | 1.1 | 125.5 | -23.4 | 154.8 | 432.0 | 296.1 | 406.4 | 557.6 | 765.3 | 1,050.1 |
| EBIT, % | 0.57392 | 56.6 | -6.38 | 67.06 | 78.7 | 39.31 | 39.31 | 39.31 | 39.31 | 39.31 |
| Total Cash | 82.1 | 154.9 | 415.0 | 343.7 | 184.4 | 524.4 | 719.6 | 987.5 | 1,355.1 | 1,859.6 |
| Total Cash, percent | .0 | .0 | .0 | .0 | .0 | .0 | .0 | .0 | .0 | .0 |
| Account Receivables | 2,875.3 | 4,528.2 | 5,321.1 | 4,989.8 | 5,195.7 | 753.3 | 1,033.7 | 1,418.6 | 1,946.7 | 2,671.4 |
| Account Receivables, % | 1561.24 | 2042.98 | 1448.46 | 2162 | 946.53 | 100 | 100 | 100 | 100 | 100 |
| Inventories | 26.5 | .0 | .0 | .0 | .0 | 21.7 | 29.8 | 40.8 | 56.0 | 76.9 |
| Inventories, % | 14.39 | 0 | 0 | 0 | 0 | 2.88 | 2.88 | 2.88 | 2.88 | 2.88 |
| Accounts Payable | 5.1 | 12.7 | 17.7 | 13.3 | 14.4 | 32.7 | 44.9 | 61.7 | 84.6 | 116.1 |
| Accounts Payable, % | 2.78 | 5.73 | 4.81 | 5.78 | 2.63 | 4.35 | 4.35 | 4.35 | 4.35 | 4.35 |
| Capital Expenditure | .0 | 2,881.4 | -.7 | .0 | .0 | -.3 | -.4 | -.5 | -.7 | -1.0 |
| Capital Expenditure, % | 0 | 1300 | -0.18048 | 0 | 0 | -0.03609538 | -0.03609538 | -0.03609538 | -0.03609538 | -0.03609538 |
| Tax Rate, % | 26.34 | 26.34 | 26.34 | 26.34 | 26.34 | 26.34 | 26.34 | 26.34 | 26.34 | 26.34 |
| EBITAT | 1.1 | 110.0 | -24.5 | 158.5 | 318.2 | 273.2 | 375.0 | 514.6 | 706.1 | 969.0 |
| Depreciation | ||||||||||
| Changes in Account Receivables | ||||||||||
| Changes in Inventories | ||||||||||
| Changes in Accounts Payable | ||||||||||
| Capital Expenditure | ||||||||||
| UFCF | -2,832.1 | 1,414.3 | -683.0 | 493.9 | 118.9 | 4,852.6 | 291.2 | 399.6 | 548.4 | 752.5 |
| WACC, % | 8.05 | 7.24 | 8.05 | 8.05 | 6.31 | 7.54 | 7.54 | 7.54 | 7.54 | 7.54 |
| PV UFCF | ||||||||||
| SUM PV UFCF | 6,019.1 | |||||||||
| Long Term Growth Rate, % | 2.00 | |||||||||
| Free cash flow (T + 1) | 768 | |||||||||
| Terminal Value | 13,864 | |||||||||
| Present Terminal Value | 9,640 | |||||||||
| Enterprise Value | 15,659 | |||||||||
| Net Debt | 4,129 | |||||||||
| Equity Value | 11,531 | |||||||||
| Diluted Shares Outstanding, MM | 82 | |||||||||
| Equity Value Per Share | 140.89 |
What You Will Get
- Editable Forecast Inputs: Easily modify assumptions (growth %, margins, WACC) to explore various scenarios.
- Real-World Data: Franklin BSP Realty Trust, Inc. (FBRT) financial data pre-loaded to facilitate your analysis.
- Automatic DCF Outputs: The template computes Net Present Value (NPV) and intrinsic value for you.
- Customizable and Professional: A sleek Excel model that adjusts to your valuation requirements.
- Built for Analysts and Investors: Perfect for evaluating projections, confirming strategies, and enhancing efficiency.
Key Features
- Comprehensive DCF Calculator: Offers detailed unlevered and levered DCF valuation models tailored for Franklin BSP Realty Trust, Inc. (FBRT).
- WACC Calculator: Features a pre-built Weighted Average Cost of Capital sheet with adjustable parameters.
- Customizable Forecast Assumptions: Easily alter growth rates, capital expenditures, and discount rates.
- Integrated Financial Ratios: Evaluate profitability, leverage, and efficiency ratios specific to Franklin BSP Realty Trust, Inc. (FBRT).
- Interactive Dashboard and Charts: Visual representations summarize essential valuation metrics for straightforward analysis.
How It Works
- 1. Access the Template: Download and open the Excel file featuring Franklin BSP Realty Trust, Inc.'s (FBRT) preloaded data.
- 2. Adjust Assumptions: Modify key inputs such as growth rates, WACC, and capital expenditures to fit your analysis.
- 3. See Results Immediately: The DCF model automatically calculates intrinsic value and NPV based on your inputs.
- 4. Explore Scenarios: Evaluate various forecasts to understand different valuation outcomes for (FBRT).
- 5. Present with Assurance: Share professional valuation insights to enhance your decision-making process.
Why Choose This Calculator for Franklin BSP Realty Trust, Inc. (FBRT)?
- User-Friendly Interface: Crafted for both novices and seasoned professionals.
- Customizable Inputs: Adjust parameters easily to suit your financial analysis.
- Real-Time Valuation: Observe immediate updates to FBRT’s valuation as you change inputs.
- Preloaded Data: Comes with Franklin BSP Realty Trust’s actual financial metrics for swift evaluations.
- Relied Upon by Experts: Trusted by investors and analysts for making well-informed choices.
Who Should Use This Product?
- Investors: Accurately assess Franklin BSP Realty Trust, Inc.'s (FBRT) fair value before making investment choices.
- CFOs: Utilize a professional-grade DCF model for financial reporting and analysis related to (FBRT).
- Consultants: Efficiently customize the template for valuation reports tailored to (FBRT) clients.
- Entrepreneurs: Acquire insights into financial modeling practices employed by industry leaders like (FBRT).
- Educators: Implement it as a teaching resource to illustrate valuation methodologies relevant to (FBRT).
What the Template Contains
- Comprehensive DCF Model: Editable template featuring detailed valuation calculations tailored for Franklin BSP Realty Trust, Inc. (FBRT).
- Real-World Data: Historical and projected financials for Franklin BSP Realty Trust, Inc. (FBRT) preloaded for thorough analysis.
- Customizable Parameters: Modify WACC, growth rates, and tax assumptions to explore various scenarios.
- Financial Statements: Complete annual and quarterly breakdowns for enhanced insights into performance.
- Key Ratios: Integrated analysis for assessing profitability, efficiency, and leverage.
- Dashboard with Visual Outputs: Visualizations including charts and tables for clear and actionable results.
Disclaimer
All information, articles, and product details provided on this website are for general informational and educational purposes only. We do not claim any ownership over, nor do we intend to infringe upon, any trademarks, copyrights, logos, brand names, or other intellectual property mentioned or depicted on this site. Such intellectual property remains the property of its respective owners, and any references here are made solely for identification or informational purposes, without implying any affiliation, endorsement, or partnership.
We make no representations or warranties, express or implied, regarding the accuracy, completeness, or suitability of any content or products presented. Nothing on this website should be construed as legal, tax, investment, financial, medical, or other professional advice. In addition, no part of this site—including articles or product references—constitutes a solicitation, recommendation, endorsement, advertisement, or offer to buy or sell any securities, franchises, or other financial instruments, particularly in jurisdictions where such activity would be unlawful.
All content is of a general nature and may not address the specific circumstances of any individual or entity. It is not a substitute for professional advice or services. Any actions you take based on the information provided here are strictly at your own risk. You accept full responsibility for any decisions or outcomes arising from your use of this website and agree to release us from any liability in connection with your use of, or reliance upon, the content or products found herein.