
|
Phoenix New Media Limited (Feng) DCF تقييم |
Fully Editable: Tailor To Your Needs In Excel Or Sheets
Professional Design: Trusted, Industry-Standard Templates
Investor-Approved Valuation Models
MAC/PC Compatible, Fully Unlocked
No Expertise Is Needed; Easy To Follow
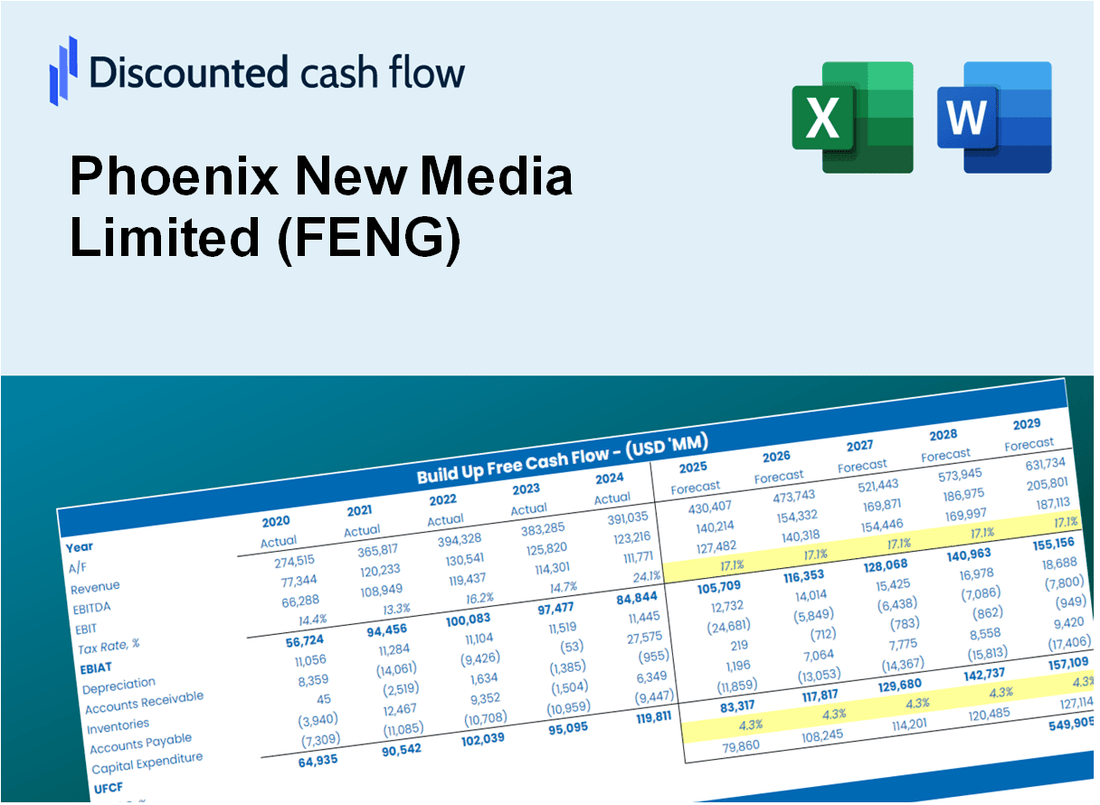
Phoenix New Media Limited (FENG) Bundle
تم تصميم حاسبة DCF الخاصة بنا (FENG) DCF ، التي تم تصميمها للدقة ، من تقييم تقييم Media New Media New Media باستخدام البيانات المالية الحديثة والمرونة الكاملة لتعديل جميع المعلمات الأساسية للتوقعات المحسنة.
Discounted Cash Flow (DCF) - (USD MM)
| Year | AY1 2020 |
AY2 2021 |
AY3 2022 |
AY4 2023 |
AY5 2024 |
FY1 2025 |
FY2 2026 |
FY3 2027 |
FY4 2028 |
FY5 2029 |
|---|---|---|---|---|---|---|---|---|---|---|
| Revenue | 169.9 | 144.8 | 110.5 | 97.3 | 98.9 | 86.9 | 76.3 | 67.0 | 58.8 | 51.7 |
| Revenue Growth, % | 0 | -14.77 | -23.74 | -11.92 | 1.69 | -12.19 | -12.19 | -12.19 | -12.19 | -12.19 |
| EBITDA | -9.2 | -38.0 | -19.2 | -11.7 | -6.1 | -11.7 | -10.2 | -9.0 | -7.9 | -6.9 |
| EBITDA, % | -5.41 | -26.21 | -17.4 | -12.01 | -6.14 | -13.43 | -13.43 | -13.43 | -13.43 | -13.43 |
| Depreciation | 5.5 | 9.3 | 7.7 | 6.0 | 3.0 | 4.5 | 3.9 | 3.5 | 3.0 | 2.7 |
| Depreciation, % | 3.22 | 6.41 | 6.97 | 6.15 | 3.06 | 5.16 | 5.16 | 5.16 | 5.16 | 5.16 |
| EBIT | -14.7 | -47.2 | -26.9 | -17.7 | -9.1 | -16.2 | -14.2 | -12.5 | -10.9 | -9.6 |
| EBIT, % | -8.63 | -32.62 | -24.36 | -18.16 | -9.2 | -18.6 | -18.6 | -18.6 | -18.6 | -18.6 |
| Total Cash | 230.2 | 210.6 | 161.0 | 152.7 | 145.6 | 86.9 | 76.3 | 67.0 | 58.8 | 51.7 |
| Total Cash, percent | .0 | .0 | .0 | .0 | .0 | .0 | .0 | .0 | .0 | .0 |
| Account Receivables | 99.6 | 72.3 | 67.2 | 49.4 | 56.7 | 48.2 | 42.3 | 37.2 | 32.6 | 28.7 |
| Account Receivables, % | 58.59 | 49.89 | 60.86 | 50.76 | 57.3 | 55.48 | 55.48 | 55.48 | 55.48 | 55.48 |
| Inventories | 4.4 | 2.2 | 1.3 | .0 | .0 | .9 | .8 | .7 | .6 | .5 |
| Inventories, % | 2.57 | 1.52 | 1.15 | 0 | 0 | 1.05 | 1.05 | 1.05 | 1.05 | 1.05 |
| Accounts Payable | 31.1 | 30.5 | 24.9 | 17.2 | 20.3 | 17.4 | 15.3 | 13.4 | 11.8 | 10.3 |
| Accounts Payable, % | 18.3 | 21.08 | 22.52 | 17.65 | 20.56 | 20.02 | 20.02 | 20.02 | 20.02 | 20.02 |
| Capital Expenditure | -1.7 | -2.4 | -4.8 | -1.4 | -.7 | -1.6 | -1.4 | -1.2 | -1.1 | -.9 |
| Capital Expenditure, % | -1 | -1.63 | -4.32 | -1.4 | -0.74194 | -1.82 | -1.82 | -1.82 | -1.82 | -1.82 |
| Tax Rate, % | -10.88 | -10.88 | -10.88 | -10.88 | -10.88 | -10.88 | -10.88 | -10.88 | -10.88 | -10.88 |
| EBITAT | -10.3 | -38.5 | -22.4 | -18.8 | -10.1 | -14.0 | -12.3 | -10.8 | -9.5 | -8.4 |
| Depreciation | ||||||||||
| Changes in Account Receivables | ||||||||||
| Changes in Inventories | ||||||||||
| Changes in Accounts Payable | ||||||||||
| Capital Expenditure | ||||||||||
| UFCF | -79.3 | -2.7 | -19.2 | -2.8 | -11.9 | -6.5 | -5.9 | -5.2 | -4.6 | -4.0 |
| WACC, % | 2.75 | 3.15 | 3.21 | 3.8 | 3.8 | 3.34 | 3.34 | 3.34 | 3.34 | 3.34 |
| PV UFCF | ||||||||||
| SUM PV UFCF | -24.0 | |||||||||
| Long Term Growth Rate, % | 2.00 | |||||||||
| Free cash flow (T + 1) | -4 | |||||||||
| Terminal Value | -305 | |||||||||
| Present Terminal Value | -259 | |||||||||
| Enterprise Value | -283 | |||||||||
| Net Debt | -77 | |||||||||
| Equity Value | -205 | |||||||||
| Diluted Shares Outstanding, MM | 0 | |||||||||
| Equity Value Per Share | -827.29 |
What You Will Receive
- Pre-Filled Financial Model: Phoenix New Media Limited’s (FENG) actual data allows for accurate DCF valuation.
- Comprehensive Forecast Control: Modify revenue growth, profit margins, WACC, and other essential drivers.
- Real-Time Calculations: Automatic updates provide immediate feedback as you adjust inputs.
- Professional-Grade Template: A polished Excel file crafted for high-quality valuation presentations.
- Flexible and Reusable: Designed for adaptability, enabling repeated application for in-depth forecasts.
Key Features
- 🔍 Real-Life FENG Financials: Pre-filled historical and projected data for Phoenix New Media Limited (FENG).
- ✏️ Fully Customizable Inputs: Adjust all critical parameters (yellow cells) like WACC, growth %, and tax rates.
- 📊 Professional DCF Valuation: Built-in formulas calculate Phoenix New Media’s intrinsic value using the Discounted Cash Flow method.
- ⚡ Instant Results: Visualize Phoenix New Media’s valuation instantly after making changes.
- Scenario Analysis: Test and compare outcomes for various financial assumptions side-by-side.
How It Works
- Step 1: Download the Excel file.
- Step 2: Review pre-entered Phoenix New Media Limited (FENG) data (historical and projected).
- Step 3: Adjust key assumptions (yellow cells) based on your analysis.
- Step 4: View automatic recalculations for Phoenix New Media Limited’s intrinsic value.
- Step 5: Use the outputs for investment decisions or reporting.
Why Choose This Calculator for Phoenix New Media Limited (FENG)?
- All-in-One Solution: Features DCF, WACC, and financial ratio analyses tailored for (FENG).
- Flexible Inputs: Modify the yellow-highlighted cells to explore different financial scenarios.
- In-Depth Analysis: Automatically computes the intrinsic value and Net Present Value for (FENG).
- Preloaded Information: Includes historical and projected data for reliable analysis.
- High-Quality Standards: Perfect for financial analysts, investors, and business advisors focusing on (FENG).
Who Should Use This Product?
- Finance Students: Explore valuation methods and apply them using data from Phoenix New Media Limited (FENG).
- Academics: Integrate professional valuation models into your teaching or research projects.
- Investors: Evaluate your investment strategies and analyze valuation results for Phoenix New Media Limited (FENG) stock.
- Analysts: Enhance your analysis process with a customizable DCF model tailored for Phoenix New Media Limited (FENG).
- Small Business Owners: Understand the evaluation techniques used for large public companies like Phoenix New Media Limited (FENG).
What the Template Contains
- Pre-Filled Data: Contains Phoenix New Media Limited's historical financials and projections.
- Discounted Cash Flow Model: An editable DCF valuation model with automated calculations.
- Weighted Average Cost of Capital (WACC): A dedicated sheet to compute WACC based on user-defined inputs.
- Key Financial Ratios: Assess Phoenix New Media Limited's profitability, efficiency, and leverage.
- Customizable Inputs: Easily modify revenue growth, profit margins, and tax rates.
- Clear Dashboard: Visualizations and tables summarizing essential valuation outcomes.
Disclaimer
All information, articles, and product details provided on this website are for general informational and educational purposes only. We do not claim any ownership over, nor do we intend to infringe upon, any trademarks, copyrights, logos, brand names, or other intellectual property mentioned or depicted on this site. Such intellectual property remains the property of its respective owners, and any references here are made solely for identification or informational purposes, without implying any affiliation, endorsement, or partnership.
We make no representations or warranties, express or implied, regarding the accuracy, completeness, or suitability of any content or products presented. Nothing on this website should be construed as legal, tax, investment, financial, medical, or other professional advice. In addition, no part of this site—including articles or product references—constitutes a solicitation, recommendation, endorsement, advertisement, or offer to buy or sell any securities, franchises, or other financial instruments, particularly in jurisdictions where such activity would be unlawful.
All content is of a general nature and may not address the specific circumstances of any individual or entity. It is not a substitute for professional advice or services. Any actions you take based on the information provided here are strictly at your own risk. You accept full responsibility for any decisions or outcomes arising from your use of this website and agree to release us from any liability in connection with your use of, or reliance upon, the content or products found herein.