
|
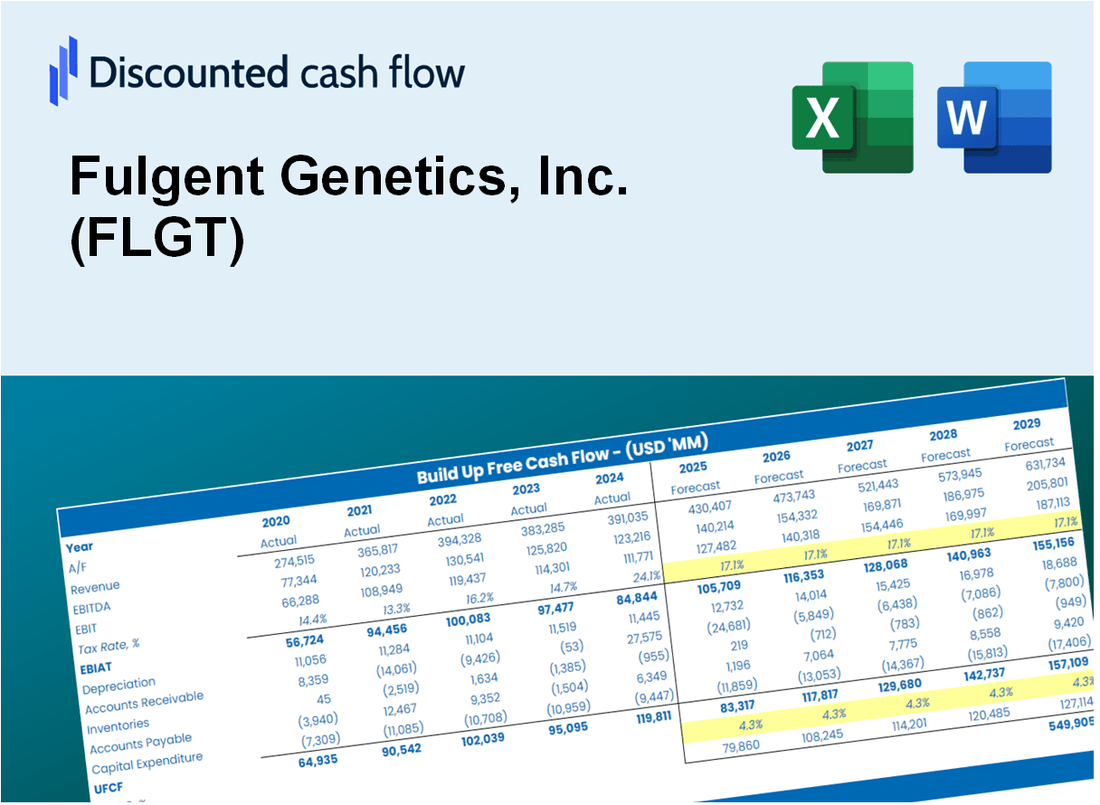
شركة Fulgent Genetics، Inc. (FLGT) تقييم DCF |
Fully Editable: Tailor To Your Needs In Excel Or Sheets
Professional Design: Trusted, Industry-Standard Templates
Investor-Approved Valuation Models
MAC/PC Compatible, Fully Unlocked
No Expertise Is Needed; Easy To Follow
Fulgent Genetics, Inc. (FLGT) Bundle
قم بتحسين وقتك وتحسين الدقة باستخدام حاسبة DCF (FLGT)! مع إمكانية الوصول إلى بيانات الوراثة الحقيقية والافتراضات القابلة للتخصيص ، تمكنك هذه الأداة من التنبؤ وتحليل وتقييم Fulgent Genetics ، Inc. مثل المستثمر المخضرم.
What You Will Get
- Real FLGT Financials: Access historical and projected data for precise valuation.
- Customizable Inputs: Adjust WACC, tax rates, revenue growth, and capital expenditures as needed.
- Dynamic Calculations: Intrinsic value and NPV are computed automatically.
- Scenario Analysis: Evaluate various scenarios to assess Fulgent Genetics' future performance.
- User-Friendly Design: Designed for professionals while remaining accessible to newcomers.
Key Features
- Real-Time FLGT Data: Pre-loaded with Fulgent Genetics’ historical financial metrics and future projections.
- Customizable Assumptions: Modify revenue growth rates, profit margins, WACC, tax rates, and capital expenditures as needed.
- Interactive Valuation Model: Automatically refreshes Net Present Value (NPV) and intrinsic value based on your modifications.
- Scenario Analysis: Develop various forecast scenarios to explore different valuation possibilities.
- User-Centric Interface: Intuitive, organized, and crafted for both industry professionals and newcomers.
How It Works
- Step 1: Download the Excel file.
- Step 2: Review pre-entered Fulgent Genetics data (historical and projected).
- Step 3: Adjust key assumptions (yellow cells) based on your analysis.
- Step 4: View automatic recalculations for Fulgent Genetics’ intrinsic value.
- Step 5: Use the outputs for investment decisions or reporting.
Why Choose This Calculator for Fulgent Genetics, Inc. (FLGT)?
- Comprehensive Tool: Integrates DCF, WACC, and financial ratio analyses tailored for Fulgent Genetics.
- Customizable Inputs: Modify yellow-highlighted cells to explore different financial scenarios for FLGT.
- Detailed Insights: Automatically computes Fulgent's intrinsic value and Net Present Value.
- Preloaded Data: Includes historical and projected data for accurate financial assessments.
- Professional Quality: Perfect for financial analysts, investors, and business consultants focusing on FLGT.
Who Should Use This Product?
- Genetics Researchers: Explore advanced genetic testing methodologies and apply them to real-world data.
- Healthcare Professionals: Integrate genetic insights into patient care and treatment planning.
- Investors: Evaluate your investment strategies and analyze valuation outcomes for Fulgent Genetics, Inc. (FLGT).
- Laboratory Analysts: Enhance your analysis with a customizable genetic testing framework.
- Biotech Entrepreneurs: Understand how established companies like Fulgent Genetics are evaluated in the market.
What the Template Contains
- Preloaded FLGT Data: Historical and projected financial data, including revenue, EBIT, and capital expenditures.
- DCF and WACC Models: Professional-grade sheets for calculating intrinsic value and Weighted Average Cost of Capital.
- Editable Inputs: Yellow-highlighted cells for adjusting revenue growth, tax rates, and discount rates.
- Financial Statements: Comprehensive annual and quarterly financials for deeper analysis.
- Key Ratios: Profitability, leverage, and efficiency ratios to evaluate performance.
- Dashboard and Charts: Visual summaries of valuation outcomes and assumptions.
Disclaimer
All information, articles, and product details provided on this website are for general informational and educational purposes only. We do not claim any ownership over, nor do we intend to infringe upon, any trademarks, copyrights, logos, brand names, or other intellectual property mentioned or depicted on this site. Such intellectual property remains the property of its respective owners, and any references here are made solely for identification or informational purposes, without implying any affiliation, endorsement, or partnership.
We make no representations or warranties, express or implied, regarding the accuracy, completeness, or suitability of any content or products presented. Nothing on this website should be construed as legal, tax, investment, financial, medical, or other professional advice. In addition, no part of this site—including articles or product references—constitutes a solicitation, recommendation, endorsement, advertisement, or offer to buy or sell any securities, franchises, or other financial instruments, particularly in jurisdictions where such activity would be unlawful.
All content is of a general nature and may not address the specific circumstances of any individual or entity. It is not a substitute for professional advice or services. Any actions you take based on the information provided here are strictly at your own risk. You accept full responsibility for any decisions or outcomes arising from your use of this website and agree to release us from any liability in connection with your use of, or reliance upon, the content or products found herein.