
|
Paragon 28 ، Inc. (FNA) تقييم DCF |
Fully Editable: Tailor To Your Needs In Excel Or Sheets
Professional Design: Trusted, Industry-Standard Templates
Investor-Approved Valuation Models
MAC/PC Compatible, Fully Unlocked
No Expertise Is Needed; Easy To Follow
Paragon 28, Inc. (FNA) Bundle
كسب إتقان على تحليل تقييم Paragon 28 ، Inc. (FNA) باستخدام حاسبة DCF الحديثة لدينا! يأتي قالب Excel هذا مسبقًا مع بيانات FNA الحقيقية ، مما يتيح لك ضبط التوقعات والافتراضات لحساب القيمة الجوهرية لـ Paragon 28 ، Inc. (FNA) بدقة.
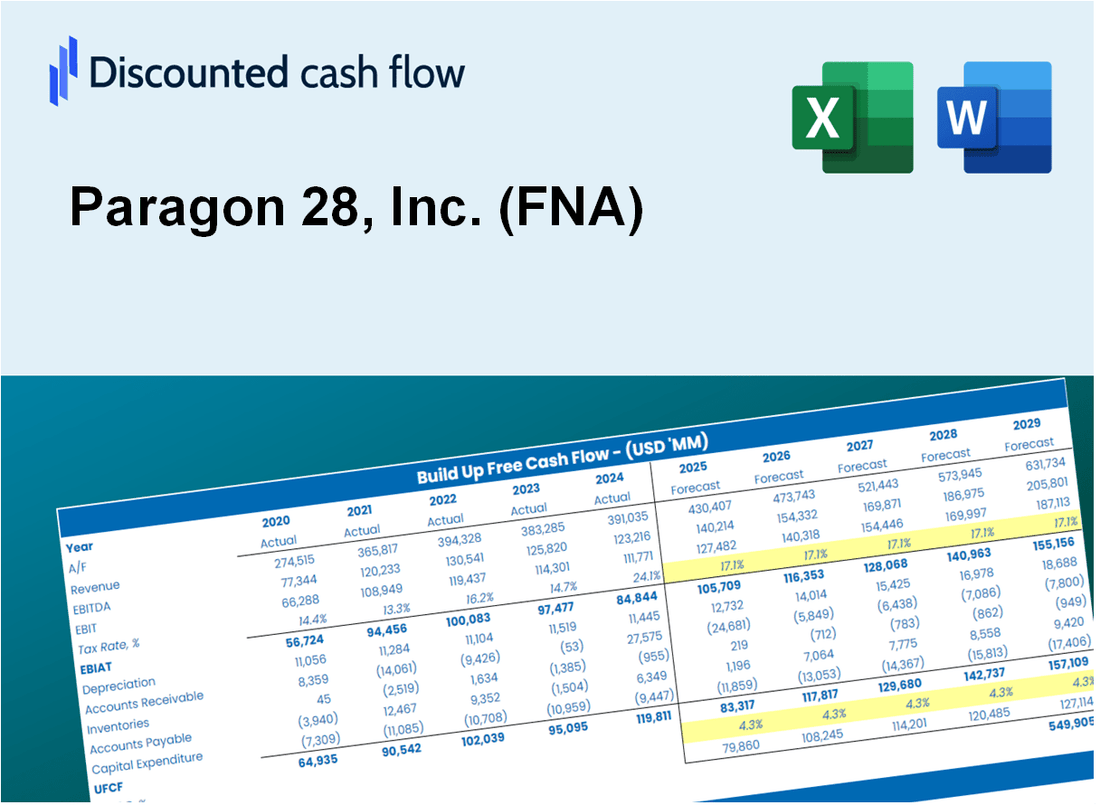
Discounted Cash Flow (DCF) - (USD MM)
| Year | AY1 2020 |
AY2 2021 |
AY3 2022 |
AY4 2023 |
AY5 2024 |
FY1 2025 |
FY2 2026 |
FY3 2027 |
FY4 2028 |
FY5 2029 |
|---|---|---|---|---|---|---|---|---|---|---|
| Revenue | 111.0 | 147.5 | 181.4 | 216.4 | 256.2 | 316.1 | 390.0 | 481.3 | 593.9 | 732.8 |
| Revenue Growth, % | 0 | 32.87 | 23 | 19.3 | 18.39 | 23.39 | 23.39 | 23.39 | 23.39 | 23.39 |
| EBITDA | 12.0 | -2.3 | -47.9 | -36.6 | -23.4 | -27.3 | -33.7 | -41.6 | -51.3 | -63.3 |
| EBITDA, % | 10.82 | -1.56 | -26.38 | -16.92 | -9.14 | -8.64 | -8.64 | -8.64 | -8.64 | -8.64 |
| Depreciation | 6.4 | 9.0 | 13.7 | 15.5 | 18.5 | 21.4 | 26.4 | 32.6 | 40.2 | 49.6 |
| Depreciation, % | 5.75 | 6.08 | 7.57 | 7.18 | 7.24 | 6.76 | 6.76 | 6.76 | 6.76 | 6.76 |
| EBIT | 5.6 | -11.3 | -61.6 | -52.2 | -41.9 | -48.7 | -60.1 | -74.1 | -91.4 | -112.8 |
| EBIT, % | 5.07 | -7.64 | -33.95 | -24.1 | -16.37 | -15.4 | -15.4 | -15.4 | -15.4 | -15.4 |
| Total Cash | 17.5 | 109.4 | 38.5 | 75.6 | 34.6 | 100.9 | 124.5 | 153.6 | 189.5 | 233.9 |
| Total Cash, percent | .0 | .0 | .0 | .0 | .0 | .0 | .0 | .0 | .0 | .0 |
| Account Receivables | 21.5 | 26.9 | 38.3 | 38.1 | 39.0 | 57.8 | 71.4 | 88.1 | 108.7 | 134.1 |
| Account Receivables, % | 19.33 | 18.21 | 21.12 | 17.62 | 15.23 | 18.3 | 18.3 | 18.3 | 18.3 | 18.3 |
| Inventories | 32.2 | 40.2 | 60.9 | 98.1 | 90.0 | 107.7 | 132.9 | 164.0 | 202.4 | 249.7 |
| Inventories, % | 29.04 | 27.29 | 33.6 | 45.32 | 35.14 | 34.08 | 34.08 | 34.08 | 34.08 | 34.08 |
| Accounts Payable | 8.8 | 13.0 | 14.9 | 21.7 | 16.0 | 26.1 | 32.2 | 39.7 | 49.0 | 60.5 |
| Accounts Payable, % | 7.94 | 8.83 | 8.24 | 10.03 | 6.24 | 8.25 | 8.25 | 8.25 | 8.25 | 8.25 |
| Capital Expenditure | -10.8 | -21.3 | -43.1 | -28.0 | -16.9 | -42.7 | -52.7 | -65.0 | -80.2 | -99.0 |
| Capital Expenditure, % | -9.77 | -14.44 | -23.75 | -12.95 | -6.62 | -13.51 | -13.51 | -13.51 | -13.51 | -13.51 |
| Tax Rate, % | -2.17 | -2.17 | -2.17 | -2.17 | -2.17 | -2.17 | -2.17 | -2.17 | -2.17 | -2.17 |
| EBITAT | 3.0 | -11.9 | -61.5 | -52.3 | -42.9 | -44.1 | -54.5 | -67.2 | -82.9 | -102.3 |
| Depreciation | ||||||||||
| Changes in Account Receivables | ||||||||||
| Changes in Inventories | ||||||||||
| Changes in Accounts Payable | ||||||||||
| Capital Expenditure | ||||||||||
| UFCF | -46.3 | -33.4 | -121.1 | -95.0 | -39.8 | -91.9 | -113.4 | -139.9 | -172.6 | -213.0 |
| WACC, % | 11.67 | 12.16 | 12.16 | 12.16 | 12.16 | 12.06 | 12.06 | 12.06 | 12.06 | 12.06 |
| PV UFCF | ||||||||||
| SUM PV UFCF | -501.7 | |||||||||
| Long Term Growth Rate, % | 2.00 | |||||||||
| Free cash flow (T + 1) | -217 | |||||||||
| Terminal Value | -2,159 | |||||||||
| Present Terminal Value | -1,222 | |||||||||
| Enterprise Value | -1,724 | |||||||||
| Net Debt | -34 | |||||||||
| Equity Value | -1,690 | |||||||||
| Diluted Shares Outstanding, MM | 83 | |||||||||
| Equity Value Per Share | -20.28 |
What You Will Get
- Real Paragon 28 Data: Preloaded financials – from revenue to EBIT – based on actual and projected figures.
- Full Customization: Adjust all critical parameters (yellow cells) like WACC, growth %, and tax rates.
- Instant Valuation Updates: Automatic recalculations to analyze the impact of changes on Paragon 28’s fair value.
- Versatile Excel Template: Tailored for quick edits, scenario testing, and detailed projections.
- Time-Saving and Accurate: Skip building models from scratch while maintaining precision and flexibility.
Key Features
- 🔍 Real-Life FNA Financials: Pre-filled historical and projected data for Paragon 28, Inc.
- ✏️ Fully Customizable Inputs: Adjust all critical parameters (yellow cells) like WACC, growth %, and tax rates.
- 📊 Professional DCF Valuation: Built-in formulas calculate Paragon 28’s intrinsic value using the Discounted Cash Flow method.
- ⚡ Instant Results: Visualize Paragon 28’s valuation instantly after making changes.
- Scenario Analysis: Test and compare outcomes for various financial assumptions side-by-side.
How It Works
- Step 1: Download the prebuilt Excel template featuring Paragon 28, Inc. (FNA) data.
- Step 2: Navigate through the pre-filled sheets to grasp the essential metrics.
- Step 3: Modify forecasts and assumptions in the editable yellow cells (WACC, growth, margins).
- Step 4: Instantly see the recalculated results, including Paragon 28, Inc. (FNA)'s intrinsic value.
- Step 5: Use the outputs to make informed investment decisions or create detailed reports.
Why Choose Paragon 28, Inc. (FNA)?
- Streamlined Processes: Eliminate the hassle of manual calculations with our user-friendly solutions.
- Enhanced Precision: Access to accurate data and methodologies minimizes valuation discrepancies.
- Completely Adaptable: Modify our tools to align with your unique forecasts and insights.
- User-Friendly Insights: Intuitive visuals and outputs facilitate straightforward analysis of results.
- Preferred by Professionals: Crafted for industry experts who prioritize both accuracy and functionality.
Who Should Use This Product?
- Individual Investors: Make informed decisions about buying or selling Paragon 28, Inc. (FNA) stock.
- Financial Analysts: Streamline valuation processes with ready-to-use financial models for Paragon 28, Inc. (FNA).
- Consultants: Deliver professional valuation insights for Paragon 28, Inc. (FNA) to clients quickly and accurately.
- Business Owners: Understand how companies like Paragon 28, Inc. (FNA) are valued to guide your own strategy.
- Finance Students: Learn valuation techniques using real-world data and scenarios related to Paragon 28, Inc. (FNA).
What the Template Contains
- Pre-Filled DCF Model: Paragon 28, Inc.'s (FNA) financial data preloaded for immediate use.
- WACC Calculator: Detailed calculations for Weighted Average Cost of Capital.
- Financial Ratios: Evaluate Paragon 28, Inc.'s (FNA) profitability, leverage, and efficiency.
- Editable Inputs: Change assumptions such as growth, margins, and CAPEX to fit your scenarios.
- Financial Statements: Annual and quarterly reports to support detailed analysis.
- Interactive Dashboard: Easily visualize key valuation metrics and results.
Disclaimer
All information, articles, and product details provided on this website are for general informational and educational purposes only. We do not claim any ownership over, nor do we intend to infringe upon, any trademarks, copyrights, logos, brand names, or other intellectual property mentioned or depicted on this site. Such intellectual property remains the property of its respective owners, and any references here are made solely for identification or informational purposes, without implying any affiliation, endorsement, or partnership.
We make no representations or warranties, express or implied, regarding the accuracy, completeness, or suitability of any content or products presented. Nothing on this website should be construed as legal, tax, investment, financial, medical, or other professional advice. In addition, no part of this site—including articles or product references—constitutes a solicitation, recommendation, endorsement, advertisement, or offer to buy or sell any securities, franchises, or other financial instruments, particularly in jurisdictions where such activity would be unlawful.
All content is of a general nature and may not address the specific circumstances of any individual or entity. It is not a substitute for professional advice or services. Any actions you take based on the information provided here are strictly at your own risk. You accept full responsibility for any decisions or outcomes arising from your use of this website and agree to release us from any liability in connection with your use of, or reliance upon, the content or products found herein.