
|
F.N.B. Corporation (FNB) تقييم DCF |
Fully Editable: Tailor To Your Needs In Excel Or Sheets
Professional Design: Trusted, Industry-Standard Templates
Investor-Approved Valuation Models
MAC/PC Compatible, Fully Unlocked
No Expertise Is Needed; Easy To Follow
F.N.B. Corporation (FNB) Bundle
اكتشف الإمكانات الحقيقية لـ F.N.B. شركة مع حاسبة DCF المتقدمة لدينا! اضبط الافتراضات الرئيسية واستكشاف السيناريوهات المختلفة وتقييم كيفية تأثير التغييرات على F.N.B. تقييم الشركة - كل ذلك ضمن قالب Excel واحد مناسب.
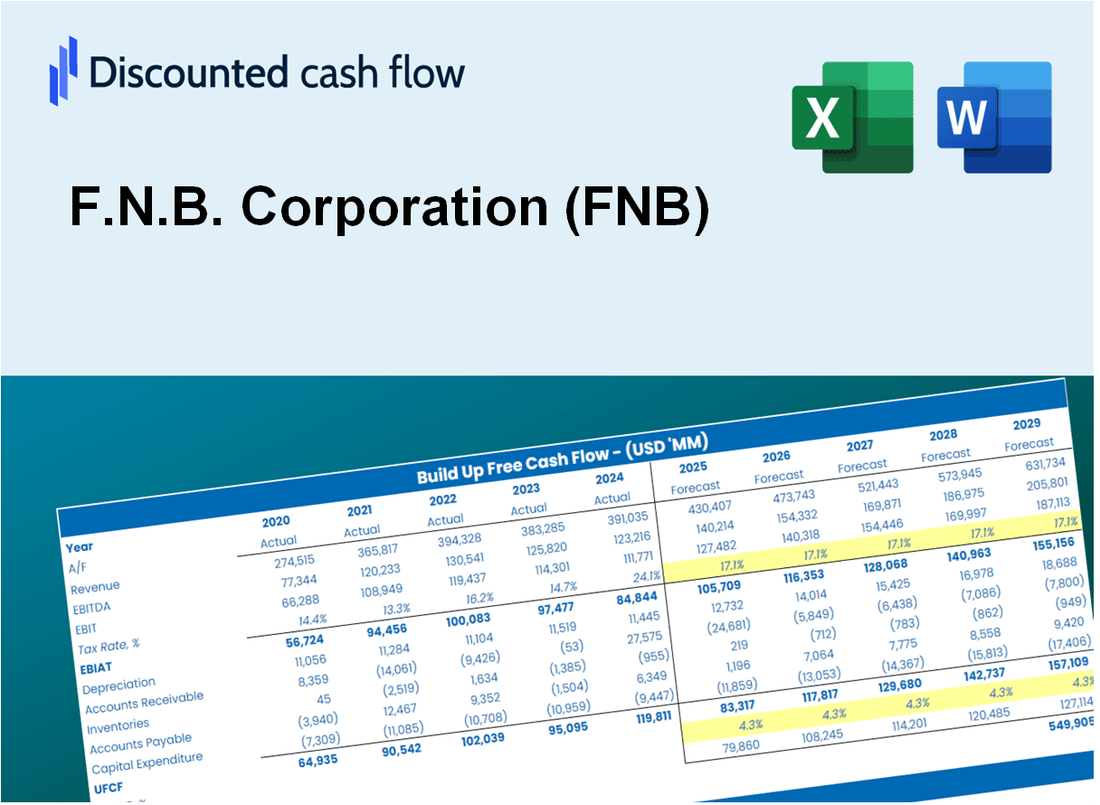
Discounted Cash Flow (DCF) - (USD MM)
| Year | AY1 2020 |
AY2 2021 |
AY3 2022 |
AY4 2023 |
AY5 2024 |
FY1 2025 |
FY2 2026 |
FY3 2027 |
FY4 2028 |
FY5 2029 |
|---|---|---|---|---|---|---|---|---|---|---|
| Revenue | 1,441.0 | 1,335.0 | 1,608.0 | 2,227.0 | 2,568.0 | 2,997.5 | 3,498.8 | 4,084.0 | 4,767.1 | 5,564.4 |
| Revenue Growth, % | 0 | -7.36 | 20.45 | 38.5 | 15.31 | 16.73 | 16.73 | 16.73 | 16.73 | 16.73 |
| EBITDA | 340.0 | 513.0 | 626.0 | 662.0 | 622.0 | 928.6 | 1,083.9 | 1,265.2 | 1,476.8 | 1,723.8 |
| EBITDA, % | 23.59 | 38.43 | 38.93 | 29.73 | 24.22 | 30.98 | 30.98 | 30.98 | 30.98 | 30.98 |
| Depreciation | -3.0 | 10.0 | 73.0 | 78.0 | 67.0 | 67.1 | 78.3 | 91.4 | 106.7 | 124.6 |
| Depreciation, % | -0.20819 | 0.74906 | 4.54 | 3.5 | 2.61 | 2.24 | 2.24 | 2.24 | 2.24 | 2.24 |
| EBIT | 343.0 | 503.0 | 553.0 | 584.0 | 555.0 | 861.5 | 1,005.6 | 1,173.8 | 1,370.1 | 1,599.3 |
| EBIT, % | 23.8 | 37.68 | 34.39 | 26.22 | 21.61 | 28.74 | 28.74 | 28.74 | 28.74 | 28.74 |
| Total Cash | 4,846.0 | 6,919.0 | 4,949.0 | 4,830.0 | 5,394.0 | 2,997.5 | 3,498.8 | 4,084.0 | 4,767.1 | 5,564.4 |
| Total Cash, percent | .0 | .0 | .0 | .0 | .0 | .0 | .0 | .0 | .0 | .0 |
| Account Receivables | 468.0 | 480.3 | 505.5 | 578.0 | 742.0 | 927.7 | 1,082.8 | 1,263.9 | 1,475.3 | 1,722.1 |
| Account Receivables, % | 32.48 | 35.98 | 31.44 | 25.95 | 28.89 | 30.95 | 30.95 | 30.95 | 30.95 | 30.95 |
| Inventories | .0 | .0 | .0 | .0 | .0 | .0 | .0 | .0 | .0 | .0 |
| Inventories, % | 0 | 0 | 0 | 0 | 0 | 0 | 0 | 0 | 0 | 0 |
| Accounts Payable | .0 | .0 | .0 | .0 | .0 | .0 | .0 | .0 | .0 | .0 |
| Accounts Payable, % | 0 | 0 | 0 | 0 | 0 | 0 | 0 | 0 | 0 | 0 |
| Capital Expenditure | -41.0 | -58.0 | -95.0 | -88.0 | -139.0 | -134.7 | -157.2 | -183.5 | -214.2 | -250.0 |
| Capital Expenditure, % | -2.85 | -4.34 | -5.91 | -3.95 | -5.41 | -4.49 | -4.49 | -4.49 | -4.49 | -4.49 |
| Tax Rate, % | 16.22 | 16.22 | 16.22 | 16.22 | 16.22 | 16.22 | 16.22 | 16.22 | 16.22 | 16.22 |
| EBITAT | 285.6 | 404.9 | 439.2 | 485.0 | 465.0 | 706.5 | 824.6 | 962.6 | 1,123.6 | 1,311.5 |
| Depreciation | ||||||||||
| Changes in Account Receivables | ||||||||||
| Changes in Inventories | ||||||||||
| Changes in Accounts Payable | ||||||||||
| Capital Expenditure | ||||||||||
| UFCF | -226.4 | 344.6 | 392.0 | 402.5 | 229.0 | 453.3 | 590.6 | 689.4 | 804.7 | 939.3 |
| WACC, % | 12.79 | 12.53 | 12.42 | 12.77 | 12.84 | 12.67 | 12.67 | 12.67 | 12.67 | 12.67 |
| PV UFCF | ||||||||||
| SUM PV UFCF | 2,366.1 | |||||||||
| Long Term Growth Rate, % | 2.00 | |||||||||
| Free cash flow (T + 1) | 958 | |||||||||
| Terminal Value | 8,978 | |||||||||
| Present Terminal Value | 4,944 | |||||||||
| Enterprise Value | 7,310 | |||||||||
| Net Debt | 1,849 | |||||||||
| Equity Value | 5,461 | |||||||||
| Diluted Shares Outstanding, MM | 363 | |||||||||
| Equity Value Per Share | 15.06 |
What You Will Receive
- Comprehensive Financial Model: F.N.B. Corporation’s actual data provides accurate DCF valuation.
- Complete Forecast Control: Modify revenue growth, profit margins, WACC, and other essential factors.
- Real-Time Calculations: Automatic updates allow you to see results instantly as adjustments are made.
- Professional-Grade Template: A polished Excel file crafted for high-quality valuation.
- Flexible and Reusable: Designed for adaptability, making it suitable for ongoing detailed forecasts.
Key Features
- Comprehensive F.N.B. Financial Data: Gain access to reliable pre-loaded historical figures and future forecasts.
- Adjustable Forecast Parameters: Modify highlighted cells for metrics like WACC, growth rates, and profit margins.
- Real-Time Calculations: Automatic recalculations for DCF, Net Present Value (NPV), and cash flow assessments.
- User-Friendly Dashboard: Intuitive charts and summaries to help you visualize your valuation insights.
- Designed for All Users: An easy-to-navigate layout tailored for investors, CFOs, and consultants alike.
How It Works
- Download the Template: Gain immediate access to the Excel-based F.N.B. Corporation (FNB) DCF Calculator.
- Input Your Assumptions: Modify the yellow-highlighted cells for growth rates, WACC, margins, and other variables.
- Instant Calculations: The model automatically recalculates F.N.B. Corporation’s (FNB) intrinsic value.
- Test Scenarios: Explore various assumptions to assess potential changes in valuation.
- Analyze and Decide: Utilize the outcomes to inform your investment or financial assessment.
Why Choose This Calculator for F.N.B. Corporation (FNB)?
- Accuracy: Utilizes real F.N.B. Corporation (FNB) financials for reliable data.
- Flexibility: Tailored for users to easily adjust and experiment with inputs.
- Time-Saving: Avoid the complexities of creating a DCF model from the ground up.
- Professional-Grade: Crafted with the precision and usability expected at the CFO level.
- User-Friendly: Intuitive design makes it accessible for users without extensive financial modeling skills.
Who Should Use F.N.B. Corporation (FNB) Services?
- Investors: Gain insights and make informed decisions with our comprehensive financial solutions.
- Financial Analysts: Enhance your analysis with our robust tools designed for efficiency and accuracy.
- Consultants: Easily customize our services for tailored client presentations and strategic recommendations.
- Finance Enthusiasts: Expand your knowledge of banking and investment strategies through our educational resources.
- Educators and Students: Utilize our platforms as a hands-on learning resource in finance and business courses.
What the Template Contains
- Pre-Filled Data: Includes F.N.B. Corporation’s historical financials and forecasts.
- Discounted Cash Flow Model: Editable DCF valuation model with automatic calculations.
- Weighted Average Cost of Capital (WACC): A dedicated sheet for calculating WACC based on custom inputs.
- Key Financial Ratios: Analyze F.N.B. Corporation’s profitability, efficiency, and leverage.
- Customizable Inputs: Edit revenue growth, margins, and tax rates with ease.
- Clear Dashboard: Charts and tables summarizing key valuation results.
Disclaimer
All information, articles, and product details provided on this website are for general informational and educational purposes only. We do not claim any ownership over, nor do we intend to infringe upon, any trademarks, copyrights, logos, brand names, or other intellectual property mentioned or depicted on this site. Such intellectual property remains the property of its respective owners, and any references here are made solely for identification or informational purposes, without implying any affiliation, endorsement, or partnership.
We make no representations or warranties, express or implied, regarding the accuracy, completeness, or suitability of any content or products presented. Nothing on this website should be construed as legal, tax, investment, financial, medical, or other professional advice. In addition, no part of this site—including articles or product references—constitutes a solicitation, recommendation, endorsement, advertisement, or offer to buy or sell any securities, franchises, or other financial instruments, particularly in jurisdictions where such activity would be unlawful.
All content is of a general nature and may not address the specific circumstances of any individual or entity. It is not a substitute for professional advice or services. Any actions you take based on the information provided here are strictly at your own risk. You accept full responsibility for any decisions or outcomes arising from your use of this website and agree to release us from any liability in connection with your use of, or reliance upon, the content or products found herein.