
|
Fossil Group ، Inc. (FOSL) DCF تقييم |
Fully Editable: Tailor To Your Needs In Excel Or Sheets
Professional Design: Trusted, Industry-Standard Templates
Investor-Approved Valuation Models
MAC/PC Compatible, Fully Unlocked
No Expertise Is Needed; Easy To Follow
Fossil Group, Inc. (FOSL) Bundle
عزز خيارات الاستثمار الخاصة بك مع حاسبة مجموعة DCF Fossil Group ، Inc. (FOSL)! استكشاف البيانات المالية الأصلية ، وضبط توقعات النمو والنفقات ، ومراقبة على الفور كيف تؤثر هذه التغييرات على القيمة الجوهرية للمجموعة الأحفورية ، Inc. (FOSL).
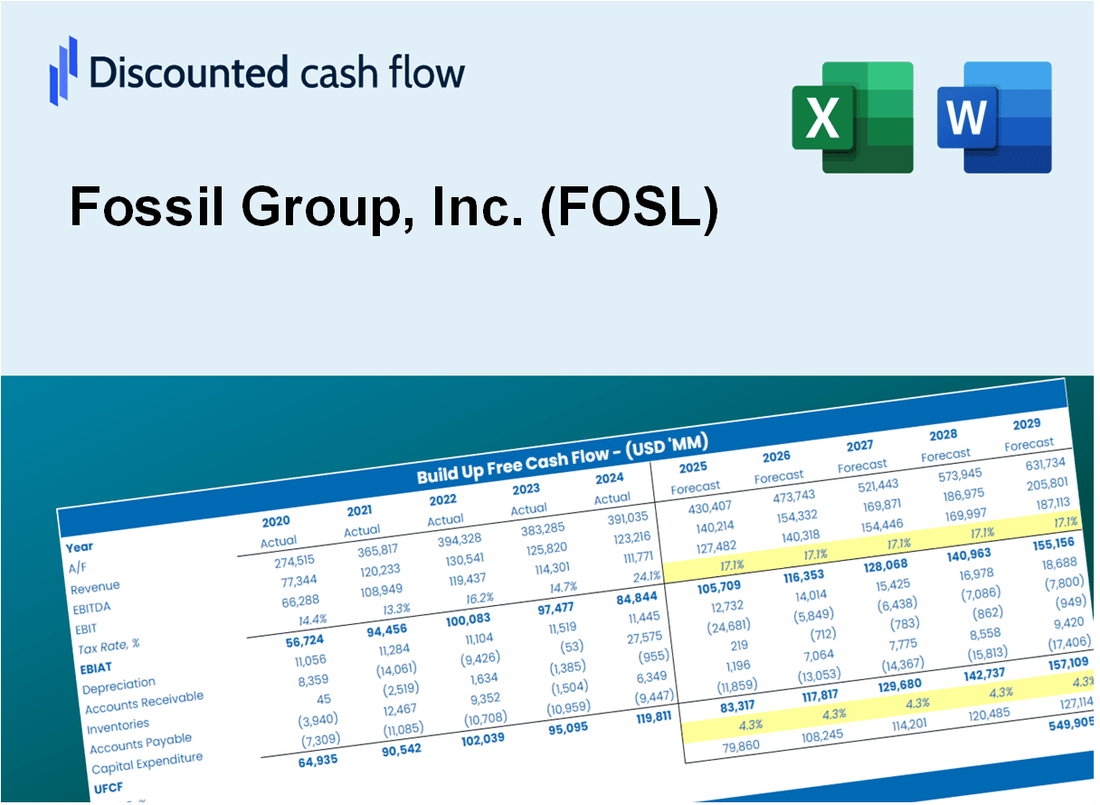
Discounted Cash Flow (DCF) - (USD MM)
| Year | AY1 2020 |
AY2 2021 |
AY3 2022 |
AY4 2023 |
AY5 2024 |
FY1 2025 |
FY2 2026 |
FY3 2027 |
FY4 2028 |
FY5 2029 |
|---|---|---|---|---|---|---|---|---|---|---|
| Revenue | 1,613.3 | 1,870.0 | 1,682.4 | 1,412.4 | 1,145.0 | 1,061.7 | 984.4 | 912.8 | 846.4 | 784.8 |
| Revenue Growth, % | 0 | 15.91 | -10.03 | -16.05 | -18.93 | -7.28 | -7.28 | -7.28 | -7.28 | -7.28 |
| EBITDA | -97.0 | 107.7 | 20.4 | -115.3 | -83.1 | -30.7 | -28.5 | -26.4 | -24.5 | -22.7 |
| EBITDA, % | -6.01 | 5.76 | 1.22 | -8.16 | -7.26 | -2.89 | -2.89 | -2.89 | -2.89 | -2.89 |
| Depreciation | 43.1 | 29.6 | 23.3 | 19.1 | 16.0 | 17.8 | 16.5 | 15.3 | 14.2 | 13.2 |
| Depreciation, % | 2.67 | 1.58 | 1.39 | 1.35 | 1.4 | 1.68 | 1.68 | 1.68 | 1.68 | 1.68 |
| EBIT | -140.1 | 78.1 | -2.9 | -134.4 | -99.1 | -48.5 | -45.0 | -41.7 | -38.7 | -35.9 |
| EBIT, % | -8.69 | 4.18 | -0.17171 | -9.51 | -8.65 | -4.57 | -4.57 | -4.57 | -4.57 | -4.57 |
| Total Cash | 316.0 | 250.8 | 198.7 | 117.8 | 123.6 | 135.8 | 125.9 | 116.7 | 108.2 | 100.4 |
| Total Cash, percent | .0 | .0 | .0 | .0 | .0 | .0 | .0 | .0 | .0 | .0 |
| Account Receivables | 238.1 | 318.2 | 260.2 | 245.3 | 162.2 | 167.3 | 155.1 | 143.8 | 133.3 | 123.6 |
| Account Receivables, % | 14.76 | 17.02 | 15.47 | 17.36 | 14.16 | 15.75 | 15.75 | 15.75 | 15.75 | 15.75 |
| Inventories | 295.3 | 346.9 | 376.0 | 252.8 | 178.6 | 196.8 | 182.5 | 169.2 | 156.9 | 145.5 |
| Inventories, % | 18.3 | 18.55 | 22.35 | 17.9 | 15.6 | 18.54 | 18.54 | 18.54 | 18.54 | 18.54 |
| Accounts Payable | 178.2 | 229.9 | 191.1 | 147.2 | 157.6 | 125.0 | 115.9 | 107.5 | 99.7 | 92.4 |
| Accounts Payable, % | 11.05 | 12.29 | 11.36 | 10.42 | 13.77 | 11.78 | 11.78 | 11.78 | 11.78 | 11.78 |
| Capital Expenditure | -10.7 | -10.3 | -13.3 | -9.9 | -6.8 | -7.0 | -6.5 | -6.0 | -5.6 | -5.2 |
| Capital Expenditure, % | -0.66285 | -0.55042 | -0.78826 | -0.70045 | -0.5897 | -0.65833 | -0.65833 | -0.65833 | -0.65833 | -0.65833 |
| Tax Rate, % | 13.04 | 13.04 | 13.04 | 13.04 | 13.04 | 13.04 | 13.04 | 13.04 | 13.04 | 13.04 |
| EBITAT | -78.3 | 37.5 | -5.8 | -135.2 | -86.2 | -37.9 | -35.2 | -32.6 | -30.2 | -28.0 |
| Depreciation | ||||||||||
| Changes in Account Receivables | ||||||||||
| Changes in Inventories | ||||||||||
| Changes in Accounts Payable | ||||||||||
| Capital Expenditure | ||||||||||
| UFCF | -401.0 | -23.3 | -5.6 | -31.8 | 90.9 | -83.0 | -7.7 | -7.2 | -6.6 | -6.2 |
| WACC, % | 6.11 | 5.75 | 8.07 | 8.07 | 7.49 | 7.1 | 7.1 | 7.1 | 7.1 | 7.1 |
| PV UFCF | ||||||||||
| SUM PV UFCF | -99.5 | |||||||||
| Long Term Growth Rate, % | 2.00 | |||||||||
| Free cash flow (T + 1) | -6 | |||||||||
| Terminal Value | -123 | |||||||||
| Present Terminal Value | -87 | |||||||||
| Enterprise Value | -187 | |||||||||
| Net Debt | 192 | |||||||||
| Equity Value | -379 | |||||||||
| Diluted Shares Outstanding, MM | 53 | |||||||||
| Equity Value Per Share | -7.16 |
What You Will Get
- Pre-Filled Financial Model: Fossil Group’s actual data enables precise DCF valuation.
- Full Forecast Control: Adjust revenue growth, margins, WACC, and other key drivers.
- Instant Calculations: Automatic updates ensure you see results as you make changes.
- Investor-Ready Template: A refined Excel file designed for professional-grade valuation.
- Customizable and Reusable: Tailored for flexibility, allowing repeated use for detailed forecasts.
Key Features
- Accurate Fossil Financials: Gain access to reliable pre-loaded historical data and future forecasts for Fossil Group, Inc. (FOSL).
- Customizable Projection Inputs: Modify highlighted fields such as WACC, growth rates, and profit margins to suit your analysis.
- Real-Time Calculations: Automatic updates for DCF, Net Present Value (NPV), and cash flow assessments.
- Interactive Dashboard: User-friendly charts and summaries to effectively visualize your valuation outcomes.
- Designed for All Skill Levels: An intuitive format tailored for investors, CFOs, and consultants alike.
How It Works
- 1. Access the Template: Download and open the Excel file containing Fossil Group, Inc.'s preloaded data.
- 2. Modify Assumptions: Adjust key inputs such as growth rates, WACC, and capital expenditures.
- 3. View Results Instantly: The DCF model automatically calculates intrinsic value and NPV.
- 4. Explore Scenarios: Analyze various forecasts to evaluate different valuation outcomes.
- 5. Present with Assurance: Share professional valuation insights to bolster your decision-making.
Why Choose This Calculator for Fossil Group, Inc. (FOSL)?
- Accurate Data: Real Fossil Group financials provide dependable valuation results.
- Customizable: Modify essential parameters such as growth rates, WACC, and tax rates to align with your forecasts.
- Time-Saving: Pre-built calculations save you from starting from the ground up.
- Professional-Grade Tool: Tailored for investors, analysts, and consultants in the retail sector.
- User-Friendly: Intuitive design and step-by-step guidance make it accessible for all users.
Who Should Use This Product?
- Investors: Accurately assess Fossil Group’s fair value before making investment choices.
- CFOs: Utilize a professional-grade DCF model for comprehensive financial reporting and analysis.
- Consultants: Easily modify the template for valuation reports tailored to clients.
- Entrepreneurs: Acquire insights into financial modeling practices employed by leading retail companies.
- Educators: Employ it as a teaching resource to illustrate valuation techniques.
What the Template Contains
- Pre-Filled Data: Includes Fossil Group's historical financials and forecasts.
- Discounted Cash Flow Model: Editable DCF valuation model with automatic calculations.
- Weighted Average Cost of Capital (WACC): A dedicated sheet for calculating WACC based on custom inputs.
- Key Financial Ratios: Analyze Fossil Group's profitability, efficiency, and leverage.
- Customizable Inputs: Edit revenue growth, margins, and tax rates with ease.
- Clear Dashboard: Charts and tables summarizing key valuation results.
Disclaimer
All information, articles, and product details provided on this website are for general informational and educational purposes only. We do not claim any ownership over, nor do we intend to infringe upon, any trademarks, copyrights, logos, brand names, or other intellectual property mentioned or depicted on this site. Such intellectual property remains the property of its respective owners, and any references here are made solely for identification or informational purposes, without implying any affiliation, endorsement, or partnership.
We make no representations or warranties, express or implied, regarding the accuracy, completeness, or suitability of any content or products presented. Nothing on this website should be construed as legal, tax, investment, financial, medical, or other professional advice. In addition, no part of this site—including articles or product references—constitutes a solicitation, recommendation, endorsement, advertisement, or offer to buy or sell any securities, franchises, or other financial instruments, particularly in jurisdictions where such activity would be unlawful.
All content is of a general nature and may not address the specific circumstances of any individual or entity. It is not a substitute for professional advice or services. Any actions you take based on the information provided here are strictly at your own risk. You accept full responsibility for any decisions or outcomes arising from your use of this website and agree to release us from any liability in connection with your use of, or reliance upon, the content or products found herein.