
|
Fox Factory Holding Corp. (FOXF) DCF تقييم |
Fully Editable: Tailor To Your Needs In Excel Or Sheets
Professional Design: Trusted, Industry-Standard Templates
Investor-Approved Valuation Models
MAC/PC Compatible, Fully Unlocked
No Expertise Is Needed; Easy To Follow
Fox Factory Holding Corp. (FOXF) Bundle
تقييم التوقعات المالية لشركة Fox Factory Holding Corp (FOXF) مثل خبير! توفر حاسبة DCF (FOXF) DCF هذه البيانات المالية المليئة مسبقًا إلى جانب المرونة لتعديل نمو الإيرادات ، و WACC ، وهامش الربح ، وغيرها من الافتراضات الحرجة التي تتماشى مع توقعاتك.
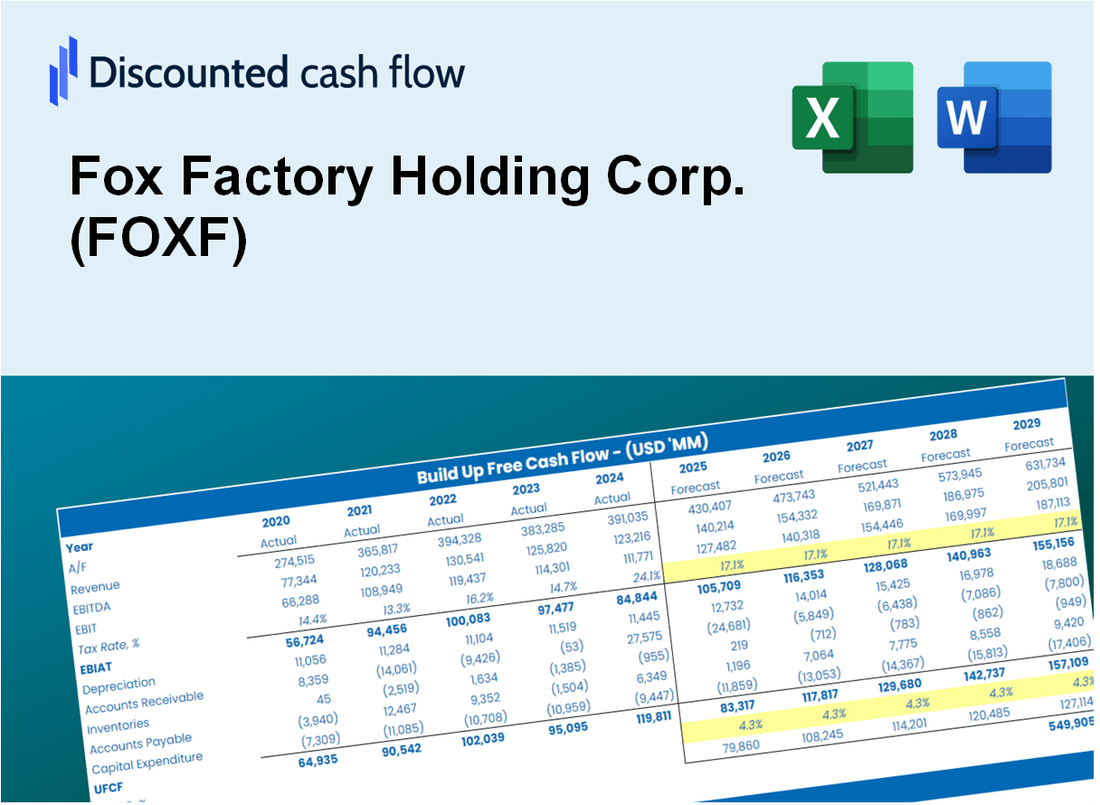
Discounted Cash Flow (DCF) - (USD MM)
| Year | AY1 2020 |
AY2 2021 |
AY3 2022 |
AY4 2023 |
AY5 2024 |
FY1 2025 |
FY2 2026 |
FY3 2027 |
FY4 2028 |
FY5 2029 |
|---|---|---|---|---|---|---|---|---|---|---|
| Revenue | 890.6 | 1,299.1 | 1,602.5 | 1,464.2 | 1,393.9 | 1,588.4 | 1,809.9 | 2,062.4 | 2,350.1 | 2,678.0 |
| Revenue Growth, % | 0 | 45.87 | 23.36 | -8.63 | -4.8 | 13.95 | 13.95 | 13.95 | 13.95 | 13.95 |
| EBITDA | 147.8 | 240.0 | 291.9 | 216.6 | 139.5 | 248.0 | 282.7 | 322.1 | 367.0 | 418.2 |
| EBITDA, % | 16.59 | 18.47 | 18.22 | 14.79 | 10.01 | 15.62 | 15.62 | 15.62 | 15.62 | 15.62 |
| Depreciation | 33.9 | 43.4 | 49.2 | 58.6 | 83.6 | 64.2 | 73.2 | 83.4 | 95.1 | 108.3 |
| Depreciation, % | 3.81 | 3.34 | 3.07 | 4 | 6 | 4.04 | 4.04 | 4.04 | 4.04 | 4.04 |
| EBIT | 113.8 | 196.5 | 242.7 | 158.0 | 56.0 | 183.8 | 209.4 | 238.7 | 272.0 | 309.9 |
| EBIT, % | 12.78 | 15.13 | 15.15 | 10.79 | 4.01 | 11.57 | 11.57 | 11.57 | 11.57 | 11.57 |
| Total Cash | 245.8 | 179.7 | 145.3 | 83.6 | 71.7 | 194.9 | 222.1 | 253.0 | 288.3 | 328.6 |
| Total Cash, percent | .0 | .0 | .0 | .0 | .0 | .0 | .0 | .0 | .0 | .0 |
| Account Receivables | 121.2 | 142.0 | 200.4 | 171.1 | 165.8 | 192.6 | 219.5 | 250.1 | 285.0 | 324.7 |
| Account Receivables, % | 13.61 | 10.93 | 12.51 | 11.68 | 11.9 | 12.13 | 12.13 | 12.13 | 12.13 | 12.13 |
| Inventories | 127.1 | 279.8 | 350.6 | 371.8 | 404.7 | 356.2 | 405.9 | 462.5 | 527.0 | 600.5 |
| Inventories, % | 14.27 | 21.54 | 21.88 | 25.4 | 29.04 | 22.42 | 22.42 | 22.42 | 22.42 | 22.42 |
| Accounts Payable | 92.4 | 100.0 | 131.2 | 104.2 | 144.1 | 138.8 | 158.2 | 180.3 | 205.4 | 234.1 |
| Accounts Payable, % | 10.38 | 7.7 | 8.18 | 7.11 | 10.34 | 8.74 | 8.74 | 8.74 | 8.74 | 8.74 |
| Capital Expenditure | -56.7 | -54.8 | -43.7 | -46.9 | -44.0 | -62.5 | -71.2 | -81.2 | -92.5 | -105.4 |
| Capital Expenditure, % | -6.37 | -4.22 | -2.73 | -3.2 | -3.16 | -3.94 | -3.94 | -3.94 | -3.94 | -3.94 |
| Tax Rate, % | -547.23 | -547.23 | -547.23 | -547.23 | -547.23 | -547.23 | -547.23 | -547.23 | -547.23 | -547.23 |
| EBITAT | 98.7 | 170.9 | 213.1 | 137.7 | 362.2 | 164.9 | 187.9 | 214.2 | 244.0 | 278.1 |
| Depreciation | ||||||||||
| Changes in Account Receivables | ||||||||||
| Changes in Inventories | ||||||||||
| Changes in Accounts Payable | ||||||||||
| Capital Expenditure | ||||||||||
| UFCF | -80.0 | -6.5 | 120.7 | 130.6 | 413.9 | 183.2 | 132.7 | 151.2 | 172.3 | 196.4 |
| WACC, % | 8.5 | 8.51 | 8.55 | 8.52 | 9.06 | 8.63 | 8.63 | 8.63 | 8.63 | 8.63 |
| PV UFCF | ||||||||||
| SUM PV UFCF | 652.7 | |||||||||
| Long Term Growth Rate, % | 3.00 | |||||||||
| Free cash flow (T + 1) | 202 | |||||||||
| Terminal Value | 3,593 | |||||||||
| Present Terminal Value | 2,375 | |||||||||
| Enterprise Value | 3,028 | |||||||||
| Net Debt | 650 | |||||||||
| Equity Value | 2,378 | |||||||||
| Diluted Shares Outstanding, MM | 42 | |||||||||
| Equity Value Per Share | 57.00 |
What You Will Get
- Real Fox Factory Data: Preloaded financials – from revenue to EBIT – based on actual and projected figures.
- Full Customization: Adjust all critical parameters (yellow cells) like WACC, growth %, and tax rates.
- Instant Valuation Updates: Automatic recalculations to analyze the impact of changes on Fox Factory’s fair value.
- Versatile Excel Template: Tailored for quick edits, scenario testing, and detailed projections.
- Time-Saving and Accurate: Skip building models from scratch while maintaining precision and flexibility.
Key Features
- 🔍 Real-Life FOXF Financials: Pre-filled historical and projected data for Fox Factory Holding Corp.
- ✏️ Fully Customizable Inputs: Adjust all critical parameters (yellow cells) like WACC, growth %, and tax rates.
- 📊 Professional DCF Valuation: Built-in formulas calculate Fox Factory’s intrinsic value using the Discounted Cash Flow method.
- ⚡ Instant Results: Visualize Fox Factory’s valuation instantly after making changes.
- Scenario Analysis: Test and compare outcomes for various financial assumptions side-by-side.
How It Works
- Download: Obtain the ready-to-use Excel file featuring Fox Factory Holding Corp.'s (FOXF) financial data.
- Customize: Modify forecasts, including revenue growth, EBITDA %, and WACC.
- Update Automatically: The intrinsic value and NPV calculations refresh in real-time.
- Test Scenarios: Develop multiple projections and compare results instantly.
- Make Decisions: Utilize the valuation findings to inform your investment strategy.
Why Choose This Calculator for Fox Factory Holding Corp. (FOXF)?
- Accuracy: Utilizes real financial data from Fox Factory for precise calculations.
- Flexibility: Allows users to easily adjust and experiment with various inputs.
- Time-Saving: Eliminate the need to create a DCF model from the ground up.
- Professional-Grade: Crafted with the expertise and detail expected by CFOs.
- User-Friendly: Intuitive design makes it accessible for users with limited financial modeling skills.
Who Should Use This Product?
- Finance Students: Explore advanced valuation techniques and apply them to real-world data from Fox Factory Holding Corp. (FOXF).
- Academics: Integrate industry-standard models into your research or teaching materials focused on Fox Factory Holding Corp. (FOXF).
- Investors: Evaluate your investment hypotheses and analyze the valuation metrics for Fox Factory Holding Corp. (FOXF).
- Analysts: Enhance your analysis process with a customizable DCF model tailored for Fox Factory Holding Corp. (FOXF).
- Small Business Owners: Understand the valuation approaches used for large public companies like Fox Factory Holding Corp. (FOXF).
What the Template Contains
- Preloaded FOXF Data: Historical and projected financial data, including revenue, EBIT, and capital expenditures.
- DCF and WACC Models: Professional-grade sheets for calculating intrinsic value and Weighted Average Cost of Capital.
- Editable Inputs: Yellow-highlighted cells for adjusting revenue growth, tax rates, and discount rates.
- Financial Statements: Comprehensive annual and quarterly financials for deeper analysis.
- Key Ratios: Profitability, leverage, and efficiency ratios to evaluate performance.
- Dashboard and Charts: Visual summaries of valuation outcomes and assumptions.
Disclaimer
All information, articles, and product details provided on this website are for general informational and educational purposes only. We do not claim any ownership over, nor do we intend to infringe upon, any trademarks, copyrights, logos, brand names, or other intellectual property mentioned or depicted on this site. Such intellectual property remains the property of its respective owners, and any references here are made solely for identification or informational purposes, without implying any affiliation, endorsement, or partnership.
We make no representations or warranties, express or implied, regarding the accuracy, completeness, or suitability of any content or products presented. Nothing on this website should be construed as legal, tax, investment, financial, medical, or other professional advice. In addition, no part of this site—including articles or product references—constitutes a solicitation, recommendation, endorsement, advertisement, or offer to buy or sell any securities, franchises, or other financial instruments, particularly in jurisdictions where such activity would be unlawful.
All content is of a general nature and may not address the specific circumstances of any individual or entity. It is not a substitute for professional advice or services. Any actions you take based on the information provided here are strictly at your own risk. You accept full responsibility for any decisions or outcomes arising from your use of this website and agree to release us from any liability in connection with your use of, or reliance upon, the content or products found herein.