
|
Freshpet ، Inc. (FRPT) تقييم DCF |
Fully Editable: Tailor To Your Needs In Excel Or Sheets
Professional Design: Trusted, Industry-Standard Templates
Investor-Approved Valuation Models
MAC/PC Compatible, Fully Unlocked
No Expertise Is Needed; Easy To Follow
Freshpet, Inc. (FRPT) Bundle
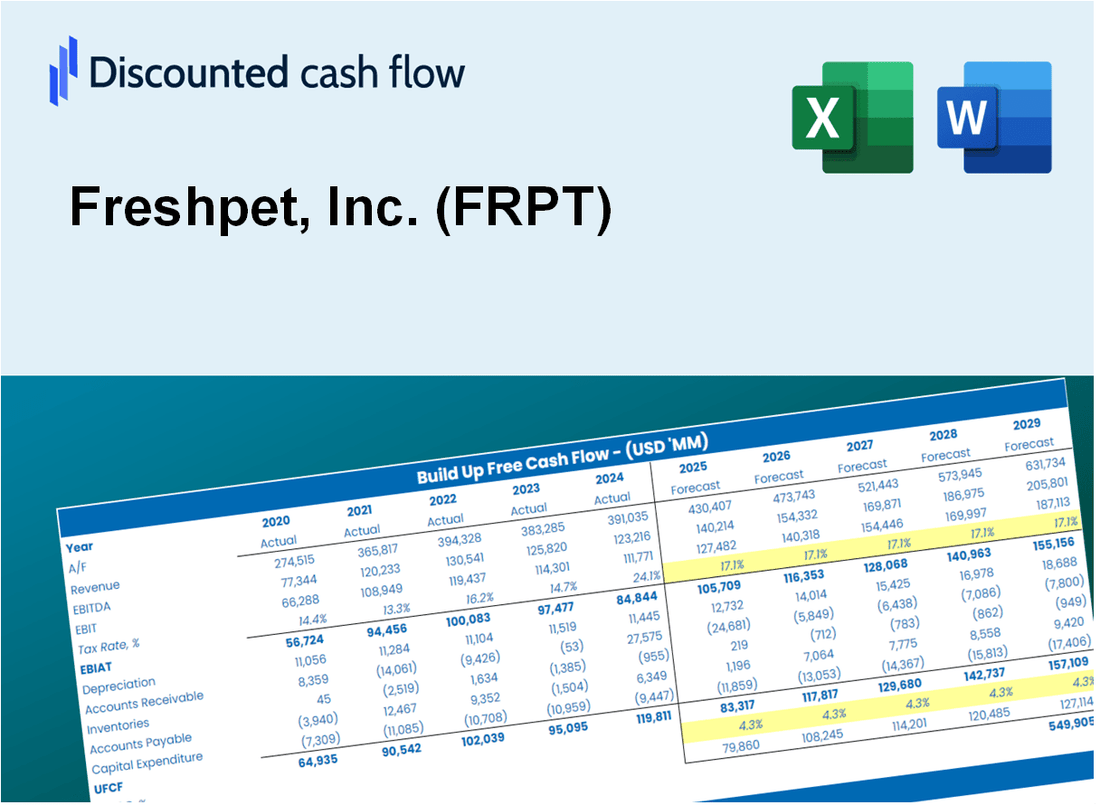
تقييم التوقعات المالية Freshpet ، Inc. (FRPT) مثل خبير! توفر لك حاسبة DCF (FRPT) هذه البيانات المالية المليئة مسبقًا والمرونة لتعديل نمو الإيرادات ، WACC ، الهوامش ، وغيرها من الافتراضات الحاسمة التي تتماشى مع تنبؤاتك.
Discounted Cash Flow (DCF) - (USD MM)
| Year | AY1 2020 |
AY2 2021 |
AY3 2022 |
AY4 2023 |
AY5 2024 |
FY1 2025 |
FY2 2026 |
FY3 2027 |
FY4 2028 |
FY5 2029 |
|---|---|---|---|---|---|---|---|---|---|---|
| Revenue | 318.8 | 425.5 | 595.3 | 766.9 | 975.2 | 1,290.6 | 1,707.9 | 2,260.3 | 2,991.3 | 3,958.7 |
| Revenue Growth, % | 0 | 33.47 | 39.92 | 28.82 | 27.16 | 32.34 | 32.34 | 32.34 | 32.34 | 32.34 |
| EBITDA | 19.2 | 7.1 | -14.3 | 41.1 | 133.4 | 62.8 | 83.1 | 110.0 | 145.6 | 192.7 |
| EBITDA, % | 6.03 | 1.68 | -2.41 | 5.36 | 13.68 | 4.87 | 4.87 | 4.87 | 4.87 | 4.87 |
| Depreciation | 21.1 | 31.8 | 35.9 | 58.5 | 73.6 | 91.1 | 120.6 | 159.6 | 211.3 | 279.6 |
| Depreciation, % | 6.63 | 7.47 | 6.03 | 7.63 | 7.55 | 7.06 | 7.06 | 7.06 | 7.06 | 7.06 |
| EBIT | -1.9 | -24.7 | -50.3 | -17.4 | 59.8 | -28.3 | -37.5 | -49.6 | -65.7 | -86.9 |
| EBIT, % | -0.59945 | -5.79 | -8.44 | -2.27 | 6.13 | -2.2 | -2.2 | -2.2 | -2.2 | -2.2 |
| Total Cash | 67.2 | 72.8 | 132.7 | 296.9 | 268.6 | 327.2 | 433.0 | 573.0 | 758.3 | 1,003.6 |
| Total Cash, percent | .0 | .0 | .0 | .0 | .0 | .0 | .0 | .0 | .0 | .0 |
| Account Receivables | 18.4 | 34.8 | 57.6 | 56.8 | 68.4 | 98.2 | 130.0 | 172.0 | 227.6 | 301.2 |
| Account Receivables, % | 5.78 | 8.17 | 9.67 | 7.4 | 7.02 | 7.61 | 7.61 | 7.61 | 7.61 | 7.61 |
| Inventories | 19.1 | 35.6 | 58.3 | 63.2 | 80.8 | 105.0 | 139.0 | 183.9 | 243.4 | 322.1 |
| Inventories, % | 6 | 8.36 | 9.79 | 8.25 | 8.29 | 8.14 | 8.14 | 8.14 | 8.14 | 8.14 |
| Accounts Payable | 16.5 | 42.6 | 55.1 | 36.1 | 39.2 | 85.6 | 113.2 | 149.9 | 198.3 | 262.5 |
| Accounts Payable, % | 5.16 | 10.01 | 9.25 | 4.71 | 4.02 | 6.63 | 6.63 | 6.63 | 6.63 | 6.63 |
| Capital Expenditure | -134.6 | -322.1 | -230.1 | -239.1 | -187.1 | -534.1 | -706.8 | -935.4 | -1,237.9 | -1,638.3 |
| Capital Expenditure, % | -42.21 | -75.7 | -38.65 | -31.18 | -19.19 | -41.38 | -41.38 | -41.38 | -41.38 | -41.38 |
| Tax Rate, % | 1.26 | 1.26 | 1.26 | 1.26 | 1.26 | 1.26 | 1.26 | 1.26 | 1.26 | 1.26 |
| EBITAT | -2.0 | -24.8 | -50.5 | -18.6 | 59.0 | -28.3 | -37.4 | -49.5 | -65.5 | -86.7 |
| Depreciation | ||||||||||
| Changes in Account Receivables | ||||||||||
| Changes in Inventories | ||||||||||
| Changes in Accounts Payable | ||||||||||
| Capital Expenditure | ||||||||||
| UFCF | -136.5 | -321.7 | -277.7 | -222.3 | -80.6 | -478.8 | -661.6 | -875.6 | -1,158.8 | -1,533.6 |
| WACC, % | 10.65 | 10.65 | 10.65 | 10.65 | 10.64 | 10.65 | 10.65 | 10.65 | 10.65 | 10.65 |
| PV UFCF | ||||||||||
| SUM PV UFCF | -3,317.1 | |||||||||
| Long Term Growth Rate, % | 2.00 | |||||||||
| Free cash flow (T + 1) | -1,564 | |||||||||
| Terminal Value | -18,085 | |||||||||
| Present Terminal Value | -10,904 | |||||||||
| Enterprise Value | -14,221 | |||||||||
| Net Debt | 155 | |||||||||
| Equity Value | -14,376 | |||||||||
| Diluted Shares Outstanding, MM | 50 | |||||||||
| Equity Value Per Share | -286.07 |
What You Will Get
- Pre-Filled Financial Model: Freshpet’s actual data allows for accurate DCF valuation.
- Full Forecast Control: Modify revenue growth, profit margins, WACC, and other critical drivers.
- Instant Calculations: Real-time updates ensure you see results as you adjust inputs.
- Investor-Ready Template: A polished Excel file crafted for high-quality valuation.
- Customizable and Reusable: Designed for flexibility, enabling repeated use for comprehensive forecasts.
Key Features
- Pre-Loaded Data: Freshpet’s historical financial statements and pre-filled forecasts.
- Fully Adjustable Inputs: Customize WACC, tax rates, revenue growth, and EBITDA margins.
- Instant Results: View Freshpet’s intrinsic value recalculating in real time.
- Clear Visual Outputs: Dashboard charts present valuation results and key metrics.
- Built for Accuracy: A professional tool tailored for analysts, investors, and finance experts.
How It Works
- Download: Get the pre-built Excel file featuring Freshpet, Inc.'s (FRPT) financial data.
- Customize: Modify projections, including sales growth, EBITDA %, and WACC.
- Update Automatically: The intrinsic value and NPV calculations refresh in real-time.
- Test Scenarios: Generate various forecasts and evaluate outcomes immediately.
- Make Decisions: Utilize the valuation findings to shape your investment approach.
Why Choose Freshpet, Inc. (FRPT)?
- Quality Ingredients: We use fresh, real meat and vegetables in our pet food.
- Health Benefits: Our recipes are designed to promote the well-being of your pets.
- Eco-Friendly Practices: Committed to sustainable sourcing and environmentally friendly packaging.
- Convenient Options: Easily accessible products that fit seamlessly into your pet care routine.
- Endorsed by Pet Owners: Trusted by thousands of satisfied customers who prioritize their pets' health.
Who Should Use Freshpet, Inc. (FRPT)?
- Pet Owners: Make informed decisions about purchasing Freshpet products for their pets' health and nutrition.
- Market Analysts: Enhance market research with comprehensive insights into the pet food industry.
- Retailers: Gain valuable information to optimize inventory and sales strategies for Freshpet offerings.
- Investors: Assess the growth potential of Freshpet, Inc. (FRPT) to inform investment choices.
- Students of Business: Explore case studies and market dynamics within the pet food sector using Freshpet as a key example.
What the Template Contains
- Pre-Filled Data: Includes Freshpet, Inc.'s historical financial performance and projections.
- Discounted Cash Flow Model: Editable DCF valuation model with automatic calculations tailored for Freshpet, Inc. (FRPT).
- Weighted Average Cost of Capital (WACC): A dedicated sheet for calculating WACC based on custom inputs specific to Freshpet, Inc. (FRPT).
- Key Financial Ratios: Analyze Freshpet, Inc.'s profitability, efficiency, and leverage metrics.
- Customizable Inputs: Easily modify revenue growth, profit margins, and tax rates.
- Clear Dashboard: Visual representations and tables summarizing key valuation outcomes for Freshpet, Inc. (FRPT).
Disclaimer
All information, articles, and product details provided on this website are for general informational and educational purposes only. We do not claim any ownership over, nor do we intend to infringe upon, any trademarks, copyrights, logos, brand names, or other intellectual property mentioned or depicted on this site. Such intellectual property remains the property of its respective owners, and any references here are made solely for identification or informational purposes, without implying any affiliation, endorsement, or partnership.
We make no representations or warranties, express or implied, regarding the accuracy, completeness, or suitability of any content or products presented. Nothing on this website should be construed as legal, tax, investment, financial, medical, or other professional advice. In addition, no part of this site—including articles or product references—constitutes a solicitation, recommendation, endorsement, advertisement, or offer to buy or sell any securities, franchises, or other financial instruments, particularly in jurisdictions where such activity would be unlawful.
All content is of a general nature and may not address the specific circumstances of any individual or entity. It is not a substitute for professional advice or services. Any actions you take based on the information provided here are strictly at your own risk. You accept full responsibility for any decisions or outcomes arising from your use of this website and agree to release us from any liability in connection with your use of, or reliance upon, the content or products found herein.