
|
تقييم شركة Forward Air Corporation (FWRD) DCF |
Fully Editable: Tailor To Your Needs In Excel Or Sheets
Professional Design: Trusted, Industry-Standard Templates
Investor-Approved Valuation Models
MAC/PC Compatible, Fully Unlocked
No Expertise Is Needed; Easy To Follow
Forward Air Corporation (FWRD) Bundle
عزز استراتيجية الاستثمار الخاصة بك مع حاسبة (FWRD) DCF! الاستفادة من البيانات المالية Air Forward Corporation الأصلية ، وضبط تنبؤات النمو والنفقات ، ومراقبة على الفور كيف تؤثر هذه التعديلات على القيمة الجوهرية لـ (FWRD).
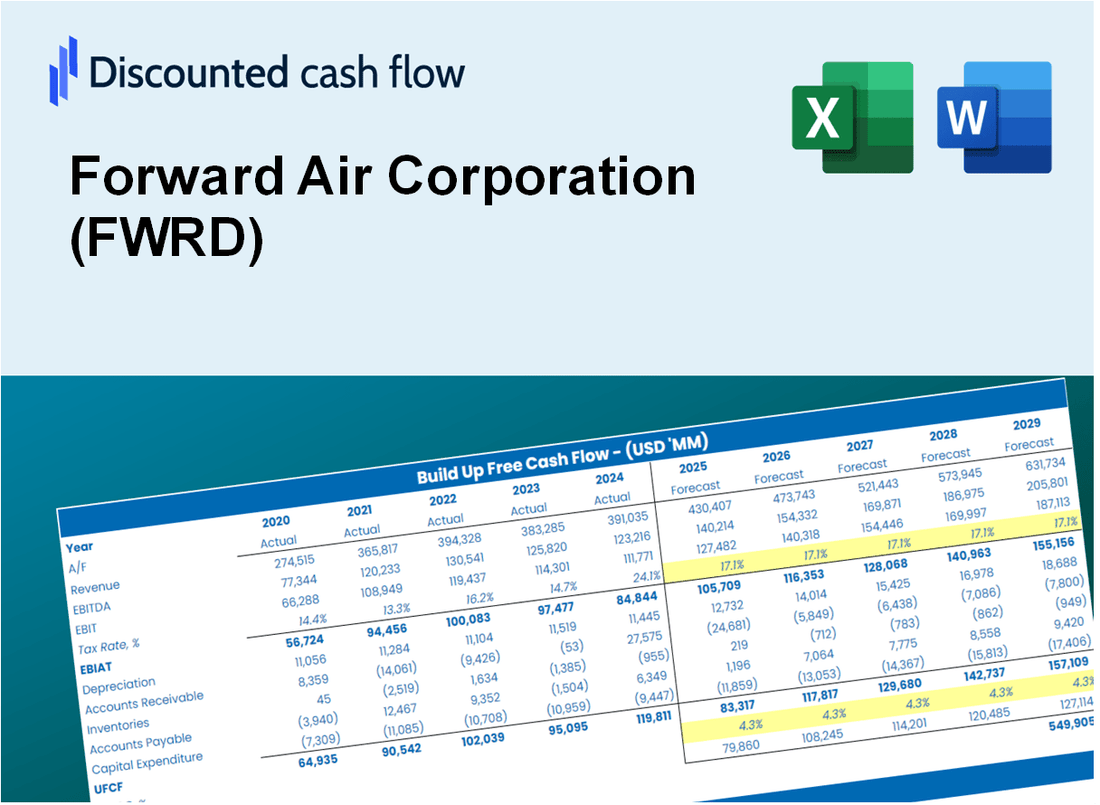
Discounted Cash Flow (DCF) - (USD MM)
| Year | AY1 2020 |
AY2 2021 |
AY3 2022 |
AY4 2023 |
AY5 2024 |
FY1 2025 |
FY2 2026 |
FY3 2027 |
FY4 2028 |
FY5 2029 |
|---|---|---|---|---|---|---|---|---|---|---|
| Revenue | 1,269.6 | 1,662.4 | 1,973.4 | 1,370.7 | 2,474.3 | 3,090.5 | 3,860.1 | 4,821.4 | 6,022.2 | 7,521.9 |
| Revenue Growth, % | 0 | 30.94 | 18.71 | -30.54 | 80.51 | 24.9 | 24.9 | 24.9 | 24.9 | 24.9 |
| EBITDA | 111.0 | 179.6 | 290.1 | 145.6 | -916.6 | 48.4 | 60.4 | 75.5 | 94.3 | 117.8 |
| EBITDA, % | 8.75 | 10.8 | 14.7 | 10.62 | -37.05 | 1.57 | 1.57 | 1.57 | 1.57 | 1.57 |
| Depreciation | 37.1 | 32.6 | 42.6 | 57.4 | 144.0 | 105.4 | 131.6 | 164.4 | 205.3 | 256.4 |
| Depreciation, % | 2.92 | 1.96 | 2.16 | 4.19 | 5.82 | 3.41 | 3.41 | 3.41 | 3.41 | 3.41 |
| EBIT | 73.9 | 147.0 | 247.6 | 88.2 | -1,060.6 | -57.0 | -71.2 | -88.9 | -111.0 | -138.7 |
| EBIT, % | 5.82 | 8.84 | 12.55 | 6.44 | -42.87 | -1.84 | -1.84 | -1.84 | -1.84 | -1.84 |
| Total Cash | 40.3 | 37.3 | 45.8 | 122.0 | 104.9 | 129.0 | 161.2 | 201.3 | 251.4 | 314.0 |
| Total Cash, percent | .0 | .0 | .0 | .0 | .0 | .0 | .0 | .0 | .0 | .0 |
| Account Receivables | 156.5 | 216.2 | 188.2 | 158.7 | 322.5 | 367.6 | 459.2 | 573.5 | 716.4 | 894.8 |
| Account Receivables, % | 12.33 | 13 | 9.54 | 11.58 | 13.03 | 11.9 | 11.9 | 11.9 | 11.9 | 11.9 |
| Inventories | 21.0 | .0 | .0 | .0 | .0 | 10.2 | 12.8 | 16.0 | 19.9 | 24.9 |
| Inventories, % | 1.65 | 0 | 0 | 0 | 0 | 0.33085 | 0.33085 | 0.33085 | 0.33085 | 0.33085 |
| Accounts Payable | 38.4 | 44.8 | 50.1 | 45.4 | 105.7 | 97.9 | 122.3 | 152.8 | 190.8 | 238.4 |
| Accounts Payable, % | 3.02 | 2.7 | 2.54 | 3.31 | 4.27 | 3.17 | 3.17 | 3.17 | 3.17 | 3.17 |
| Capital Expenditure | -20.3 | -39.1 | -40.7 | -30.7 | -37.1 | -60.3 | -75.3 | -94.0 | -117.5 | -146.7 |
| Capital Expenditure, % | -1.6 | -2.35 | -2.06 | -2.24 | -1.5 | -1.95 | -1.95 | -1.95 | -1.95 | -1.95 |
| Tax Rate, % | 34.63 | 34.63 | 34.63 | 34.63 | 34.63 | 34.63 | 34.63 | 34.63 | 34.63 | 34.63 |
| EBITAT | 25.3 | 100.4 | 197.3 | 260.6 | -693.3 | -39.6 | -49.5 | -61.8 | -77.2 | -96.4 |
| Depreciation | ||||||||||
| Changes in Account Receivables | ||||||||||
| Changes in Inventories | ||||||||||
| Changes in Accounts Payable | ||||||||||
| Capital Expenditure | ||||||||||
| UFCF | -97.0 | 61.7 | 232.3 | 312.2 | -689.9 | -57.6 | -62.9 | -78.5 | -98.1 | -122.5 |
| WACC, % | 4.48 | 6.87 | 7.67 | 9.09 | 6.66 | 6.96 | 6.96 | 6.96 | 6.96 | 6.96 |
| PV UFCF | ||||||||||
| SUM PV UFCF | -335.5 | |||||||||
| Long Term Growth Rate, % | 2.00 | |||||||||
| Free cash flow (T + 1) | -125 | |||||||||
| Terminal Value | -2,521 | |||||||||
| Present Terminal Value | -1,801 | |||||||||
| Enterprise Value | -2,137 | |||||||||
| Net Debt | 2,041 | |||||||||
| Equity Value | -4,178 | |||||||||
| Diluted Shares Outstanding, MM | 28 | |||||||||
| Equity Value Per Share | -151.70 |
What You Will Get
- Real Forward Air Data: Preloaded financials – from revenue to EBIT – based on actual and projected figures for Forward Air Corporation (FWRD).
- Full Customization: Adjust all critical parameters (yellow cells) like WACC, growth %, and tax rates to fit your analysis needs.
- Instant Valuation Updates: Automatic recalculations to assess the impact of changes on Forward Air’s fair value.
- Versatile Excel Template: Designed for quick edits, scenario testing, and in-depth projections specific to Forward Air Corporation (FWRD).
- Time-Saving and Accurate: Eliminate the hassle of building models from scratch while ensuring precision and flexibility in your evaluations.
Key Features
- Comprehensive DCF Model: Features both unlevered and levered DCF valuation frameworks tailored for Forward Air Corporation (FWRD).
- Customizable WACC Tool: Ready-to-use Weighted Average Cost of Capital sheet with adjustable parameters.
- Modifiable Forecast Inputs: Adjust growth projections, capital investments, and discount rates as needed.
- Integrated Financial Ratios: Evaluate profitability, leverage, and efficiency metrics specifically for Forward Air Corporation (FWRD).
- Interactive Dashboard and Visuals: Graphical representations that highlight essential valuation indicators for straightforward analysis.
How It Works
- Download the Template: Gain immediate access to the Excel-based FWRD DCF Calculator.
- Input Your Assumptions: Modify the yellow-highlighted cells for growth rates, WACC, margins, and other variables.
- Instant Calculations: The model automatically recalculates Forward Air’s intrinsic value.
- Test Scenarios: Experiment with various assumptions to assess potential changes in valuation.
- Analyze and Decide: Utilize the results to inform your investment or financial decisions.
Why Choose Forward Air Corporation (FWRD)?
- Streamlined Operations: Benefit from our efficient logistics solutions that save you time and resources.
- Enhanced Reliability: Our proven track record ensures dependable transportation and delivery services.
- Fully Tailored Services: Customize our offerings to meet your specific shipping and logistics needs.
- User-Friendly Technology: Our intuitive platforms make tracking and managing shipments effortless.
- Industry Expertise: Rely on our experienced team who are dedicated to providing top-notch service.
Who Should Use This Product?
- Investors: Evaluate Forward Air Corporation’s (FWRD) valuation before making investment decisions.
- CFOs and Financial Analysts: Enhance valuation methodologies and assess financial forecasts.
- Startup Founders: Gain insights into how established logistics companies like Forward Air Corporation are appraised.
- Consultants: Create detailed valuation reports for clients in the logistics sector.
- Students and Educators: Utilize real-time data to practice and instruct on valuation strategies.
What the Template Contains
- Preloaded FWRD Data: Historical and projected financial data, including revenue, EBIT, and capital expenditures.
- DCF and WACC Models: Professional-grade sheets for calculating intrinsic value and Weighted Average Cost of Capital.
- Editable Inputs: Yellow-highlighted cells for adjusting revenue growth, tax rates, and discount rates.
- Financial Statements: Comprehensive annual and quarterly financials for deeper analysis.
- Key Ratios: Profitability, leverage, and efficiency ratios to evaluate performance.
- Dashboard and Charts: Visual summaries of valuation outcomes and assumptions.
Disclaimer
All information, articles, and product details provided on this website are for general informational and educational purposes only. We do not claim any ownership over, nor do we intend to infringe upon, any trademarks, copyrights, logos, brand names, or other intellectual property mentioned or depicted on this site. Such intellectual property remains the property of its respective owners, and any references here are made solely for identification or informational purposes, without implying any affiliation, endorsement, or partnership.
We make no representations or warranties, express or implied, regarding the accuracy, completeness, or suitability of any content or products presented. Nothing on this website should be construed as legal, tax, investment, financial, medical, or other professional advice. In addition, no part of this site—including articles or product references—constitutes a solicitation, recommendation, endorsement, advertisement, or offer to buy or sell any securities, franchises, or other financial instruments, particularly in jurisdictions where such activity would be unlawful.
All content is of a general nature and may not address the specific circumstances of any individual or entity. It is not a substitute for professional advice or services. Any actions you take based on the information provided here are strictly at your own risk. You accept full responsibility for any decisions or outcomes arising from your use of this website and agree to release us from any liability in connection with your use of, or reliance upon, the content or products found herein.