
|
تقييم Gan Limited (GAN) DCF |
Fully Editable: Tailor To Your Needs In Excel Or Sheets
Professional Design: Trusted, Industry-Standard Templates
Investor-Approved Valuation Models
MAC/PC Compatible, Fully Unlocked
No Expertise Is Needed; Easy To Follow
GAN Limited (GAN) Bundle
اكتشف القيمة الحقيقية لـ Gan Limited (GAN) مع حاسبة DCF المتقدمة! اضبط الافتراضات الأساسية ، واستكشاف السيناريوهات المختلفة ، وفحص كيفية تأثير التعديلات على تقييم GAN Limited (GAN) - كل ذلك ضمن قالب Excel واحد مناسب.
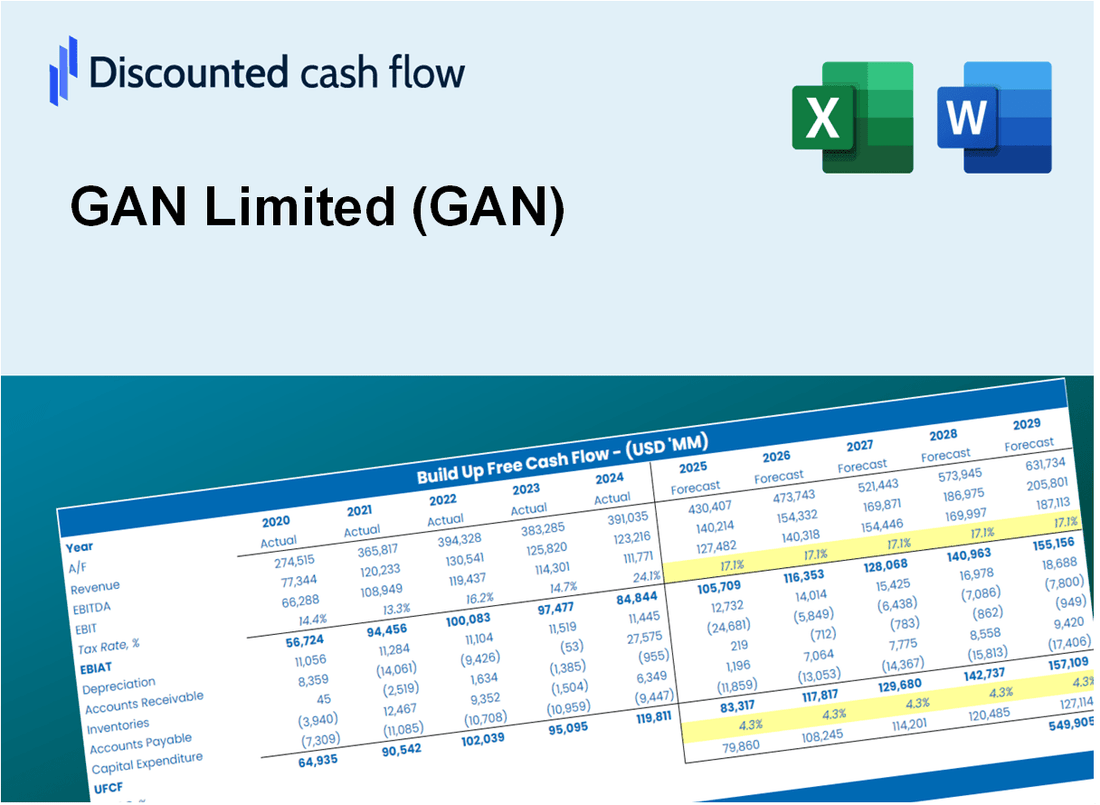
Discounted Cash Flow (DCF) - (USD MM)
| Year | AY1 2020 |
AY2 2021 |
AY3 2022 |
AY4 2023 |
AY5 2024 |
FY1 2025 |
FY2 2026 |
FY3 2027 |
FY4 2028 |
FY5 2029 |
|---|---|---|---|---|---|---|---|---|---|---|
| Revenue | 35.2 | 125.4 | 141.5 | 129.4 | 135.0 | 171.6 | 218.2 | 277.5 | 352.8 | 448.6 |
| Revenue Growth, % | 0 | 256.76 | 12.83 | -8.56 | 4.31 | 27.15 | 27.15 | 27.15 | 27.15 | 27.15 |
| EBITDA | -16.2 | -10.9 | -7.6 | -13.2 | 4.1 | -23.1 | -29.4 | -37.4 | -47.5 | -60.4 |
| EBITDA, % | -46.11 | -8.69 | -5.38 | -10.16 | 3.03 | -13.46 | -13.46 | -13.46 | -13.46 | -13.46 |
| Depreciation | 3.3 | 16.8 | 23.3 | 17.2 | 7.6 | 19.9 | 25.3 | 32.2 | 40.9 | 52.1 |
| Depreciation, % | 9.26 | 13.4 | 16.45 | 13.26 | 5.65 | 11.6 | 11.6 | 11.6 | 11.6 | 11.6 |
| EBIT | -19.5 | -27.7 | -30.9 | -30.3 | -3.5 | -43.0 | -54.7 | -69.6 | -88.4 | -112.5 |
| EBIT, % | -55.37 | -22.09 | -21.83 | -23.42 | -2.63 | -25.07 | -25.07 | -25.07 | -25.07 | -25.07 |
| Total Cash | 152.7 | 39.5 | 45.9 | 38.6 | 38.7 | 76.4 | 97.1 | 123.4 | 156.9 | 199.6 |
| Total Cash, percent | .0 | .0 | .0 | .0 | .0 | .0 | .0 | .0 | .0 | .0 |
| Account Receivables | 8.1 | 8.1 | 13.8 | 11.4 | 7.0 | 18.3 | 23.2 | 29.5 | 37.5 | 47.7 |
| Account Receivables, % | 22.91 | 6.47 | 9.76 | 8.82 | 5.22 | 10.63 | 10.63 | 10.63 | 10.63 | 10.63 |
| Inventories | 1.9 | 3.5 | 4.9 | .0 | .0 | 4.0 | 5.1 | 6.5 | 8.2 | 10.5 |
| Inventories, % | 5.44 | 2.79 | 3.43 | 0 | 0 | 2.33 | 2.33 | 2.33 | 2.33 | 2.33 |
| Accounts Payable | 4.7 | 5.3 | 6.4 | 7.0 | 5.6 | 10.9 | 13.8 | 17.6 | 22.4 | 28.4 |
| Accounts Payable, % | 13.39 | 4.2 | 4.55 | 5.39 | 4.16 | 6.34 | 6.34 | 6.34 | 6.34 | 6.34 |
| Capital Expenditure | -5.9 | -14.0 | -19.1 | -6.8 | -.5 | -16.2 | -20.6 | -26.1 | -33.2 | -42.3 |
| Capital Expenditure, % | -16.83 | -11.12 | -13.5 | -5.27 | -0.39704 | -9.42 | -9.42 | -9.42 | -9.42 | -9.42 |
| Tax Rate, % | 3.34 | 3.34 | 3.34 | 3.34 | 3.34 | 3.34 | 3.34 | 3.34 | 3.34 | 3.34 |
| EBITAT | -19.8 | -27.5 | -31.5 | -30.4 | -3.4 | -42.7 | -54.3 | -69.0 | -87.7 | -111.5 |
| Depreciation | ||||||||||
| Changes in Account Receivables | ||||||||||
| Changes in Inventories | ||||||||||
| Changes in Accounts Payable | ||||||||||
| Capital Expenditure | ||||||||||
| UFCF | -27.7 | -25.7 | -33.2 | -12.3 | 6.7 | -48.9 | -52.6 | -66.9 | -85.0 | -108.1 |
| WACC, % | 11.58 | 11.56 | 11.58 | 11.58 | 11.47 | 11.56 | 11.56 | 11.56 | 11.56 | 11.56 |
| PV UFCF | ||||||||||
| SUM PV UFCF | -251.7 | |||||||||
| Long Term Growth Rate, % | 2.00 | |||||||||
| Free cash flow (T + 1) | -110 | |||||||||
| Terminal Value | -1,154 | |||||||||
| Present Terminal Value | -668 | |||||||||
| Enterprise Value | -919 | |||||||||
| Net Debt | 12 | |||||||||
| Equity Value | -931 | |||||||||
| Diluted Shares Outstanding, MM | 45 | |||||||||
| Equity Value Per Share | -20.51 |
What You Will Receive
- Comprehensive Financial Model: GAN Limited’s (GAN) actual data facilitates accurate DCF valuation.
- Complete Forecasting Control: Modify revenue growth, profit margins, WACC, and other essential drivers.
- Real-Time Calculations: Automatic updates provide immediate insights as you adjust variables.
- Professional-Grade Template: An expertly crafted Excel file suitable for high-quality valuations.
- Flexible and Reusable: Designed for adaptability, enabling repeated applications for in-depth forecasts.
Key Features
- Comprehensive DCF Calculator: Offers detailed unlevered and levered DCF valuation models tailored for GAN Limited (GAN).
- WACC Calculator: Features a pre-built Weighted Average Cost of Capital sheet with customizable parameters specific to GAN.
- Adjustable Forecast Assumptions: Easily modify growth rates, capital expenditures, and discount rates to fit GAN's financial outlook.
- Integrated Financial Ratios: Assess profitability, leverage, and efficiency ratios relevant to GAN Limited (GAN).
- Interactive Dashboard and Charts: Visual representations summarize key valuation metrics for straightforward analysis of GAN.
How It Works
- Step 1: Download the prebuilt Excel template featuring GAN Limited’s (GAN) data.
- Step 2: Navigate through the pre-filled sheets to familiarize yourself with the essential metrics.
- Step 3: Modify forecasts and assumptions in the editable yellow cells (WACC, growth, margins).
- Step 4: Instantly see the recalculated results, including GAN Limited’s (GAN) intrinsic value.
- Step 5: Make well-informed investment choices or create reports based on the outputs.
Why Choose This Calculator for GAN Limited (GAN)?
- Accurate Data: Up-to-date GAN financials provide trustworthy valuation outcomes.
- Customizable: Tailor essential parameters like growth rates, WACC, and tax rates to fit your forecasts.
- Time-Saving: Built-in calculations save you the hassle of starting from the ground up.
- Professional-Grade Tool: Crafted for investors, analysts, and consultants alike.
- User-Friendly: Simple design and clear instructions make it accessible for all users.
Who Should Use GAN Limited (GAN)?
- Finance Students: Explore the intricacies of gaming and online betting markets using real data.
- Academics: Integrate advanced gaming models into your research or teaching materials.
- Investors: Evaluate your investment strategies and assess the performance of GAN Limited (GAN) in the market.
- Analysts: Enhance your analysis with a customizable financial model tailored for the gaming industry.
- Small Business Owners: Understand how leading gaming companies like GAN Limited (GAN) are evaluated and operated.
What the GAN Template Contains
- Operating and Balance Sheet Data: Pre-filled GAN Limited historical data and forecasts, including revenue, EBITDA, EBIT, and capital expenditures.
- WACC Calculation: A dedicated sheet for Weighted Average Cost of Capital (WACC), including parameters like Beta, risk-free rate, and share price.
- DCF Valuation (Unlevered and Levered): Editable Discounted Cash Flow models showing intrinsic value with detailed calculations.
- Financial Statements: Pre-loaded financial statements (annual and quarterly) to support analysis.
- Key Ratios: Includes profitability, leverage, and efficiency ratios for GAN Limited (GAN).
- Dashboard and Charts: Visual summary of valuation outputs and assumptions to analyze results easily.
Disclaimer
All information, articles, and product details provided on this website are for general informational and educational purposes only. We do not claim any ownership over, nor do we intend to infringe upon, any trademarks, copyrights, logos, brand names, or other intellectual property mentioned or depicted on this site. Such intellectual property remains the property of its respective owners, and any references here are made solely for identification or informational purposes, without implying any affiliation, endorsement, or partnership.
We make no representations or warranties, express or implied, regarding the accuracy, completeness, or suitability of any content or products presented. Nothing on this website should be construed as legal, tax, investment, financial, medical, or other professional advice. In addition, no part of this site—including articles or product references—constitutes a solicitation, recommendation, endorsement, advertisement, or offer to buy or sell any securities, franchises, or other financial instruments, particularly in jurisdictions where such activity would be unlawful.
All content is of a general nature and may not address the specific circumstances of any individual or entity. It is not a substitute for professional advice or services. Any actions you take based on the information provided here are strictly at your own risk. You accept full responsibility for any decisions or outcomes arising from your use of this website and agree to release us from any liability in connection with your use of, or reliance upon, the content or products found herein.