
|
Global Melementity Group ، LLC (GBLI) DCF تقييم |
Fully Editable: Tailor To Your Needs In Excel Or Sheets
Professional Design: Trusted, Industry-Standard Templates
Investor-Approved Valuation Models
MAC/PC Compatible, Fully Unlocked
No Expertise Is Needed; Easy To Follow
Global Indemnity Group, LLC (GBLI) Bundle
استكشف النظرة المالية لمجموعة Global Endemnity Group ، LLC (GBLI) مع حاسبة DCF سهلة الاستخدام! أدخل توقعاتك للنمو والهوامش والمصروفات لحساب القيمة الجوهرية لمجموعة التعويض العالمية ، LLC (GBLI) وصقل نهج الاستثمار الخاص بك.
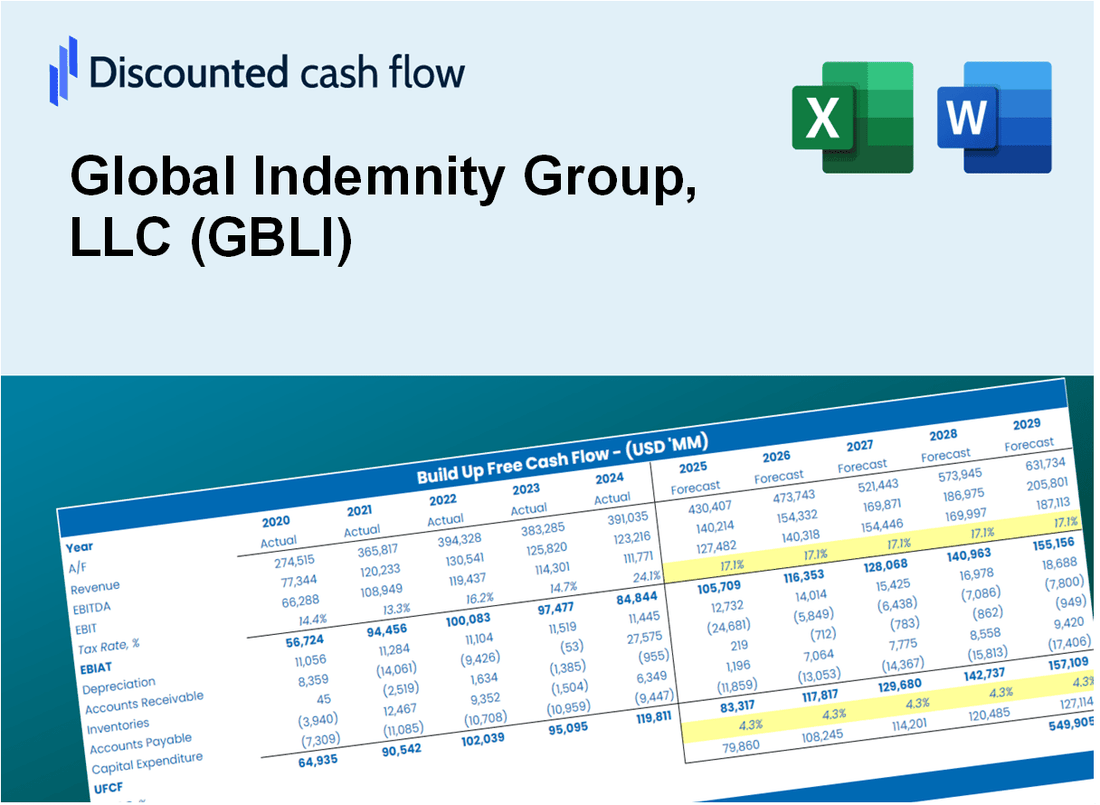
Discounted Cash Flow (DCF) - (USD MM)
| Year | AY1 2020 |
AY2 2021 |
AY3 2022 |
AY4 2023 |
AY5 2024 |
FY1 2025 |
FY2 2026 |
FY3 2027 |
FY4 2028 |
FY5 2029 |
|---|---|---|---|---|---|---|---|---|---|---|
| Revenue | 583.5 | 678.3 | 628.5 | 528.1 | 441.2 | 415.2 | 390.8 | 367.8 | 346.2 | 325.8 |
| Revenue Growth, % | 0 | 16.23 | -7.33 | -15.97 | -16.46 | -5.88 | -5.88 | -5.88 | -5.88 | -5.88 |
| EBITDA | -6.3 | 53.7 | 13.4 | 39.2 | 60.7 | 25.0 | 23.6 | 22.2 | 20.9 | 19.6 |
| EBITDA, % | -1.08 | 7.92 | 2.13 | 7.42 | 13.76 | 6.03 | 6.03 | 6.03 | 6.03 | 6.03 |
| Depreciation | 7.0 | 10.4 | 8.4 | 6.2 | 5.8 | 5.4 | 5.1 | 4.8 | 4.5 | 4.3 |
| Depreciation, % | 1.2 | 1.54 | 1.34 | 1.17 | 1.31 | 1.31 | 1.31 | 1.31 | 1.31 | 1.31 |
| EBIT | -13.3 | 43.3 | 5.0 | 33.0 | 55.0 | 19.6 | 18.4 | 17.4 | 16.3 | 15.4 |
| EBIT, % | -2.28 | 6.38 | 0.79152 | 6.24 | 12.46 | 4.72 | 4.72 | 4.72 | 4.72 | 4.72 |
| Total Cash | 1,258.5 | 1,280.1 | 1,287.0 | 1,039.1 | 1,200.8 | 415.2 | 390.8 | 367.8 | 346.2 | 325.8 |
| Total Cash, percent | .0 | .0 | .0 | .0 | .0 | .0 | .0 | .0 | .0 | .0 |
| Account Receivables | 198.1 | 228.3 | 254.5 | 186.5 | 75.1 | 133.2 | 125.4 | 118.0 | 111.1 | 104.5 |
| Account Receivables, % | 33.95 | 33.66 | 40.49 | 35.3 | 17.02 | 32.08 | 32.08 | 32.08 | 32.08 | 32.08 |
| Inventories | -369.2 | -438.6 | -443.4 | -140.2 | .0 | -186.9 | -175.9 | -165.5 | -155.8 | -146.6 |
| Inventories, % | -63.27 | -64.66 | -70.55 | -26.55 | 0 | -45 | -45 | -45 | -45 | -45 |
| Accounts Payable | 8.9 | 35.3 | 17.2 | 2.6 | 8.2 | 9.8 | 9.3 | 8.7 | 8.2 | 7.7 |
| Accounts Payable, % | 1.53 | 5.21 | 2.74 | 0.50026 | 1.85 | 2.37 | 2.37 | 2.37 | 2.37 | 2.37 |
| Capital Expenditure | -25.7 | .0 | .0 | .0 | .0 | -3.7 | -3.4 | -3.2 | -3.1 | -2.9 |
| Capital Expenditure, % | -4.41 | 0 | 0 | 0 | 0 | -0.88151 | -0.88151 | -0.88151 | -0.88151 | -0.88151 |
| Tax Rate, % | 21.32 | 21.32 | 21.32 | 21.32 | 21.32 | 21.32 | 21.32 | 21.32 | 21.32 | 21.32 |
| EBITAT | -9.6 | 38.7 | -2.1 | 25.4 | 43.2 | 12.4 | 11.7 | 11.0 | 10.4 | 9.8 |
| Depreciation | ||||||||||
| Changes in Account Receivables | ||||||||||
| Changes in Inventories | ||||||||||
| Changes in Accounts Payable | ||||||||||
| Capital Expenditure | ||||||||||
| UFCF | 151.7 | 114.8 | -33.2 | -218.2 | 25.7 | 144.6 | 9.6 | 9.1 | 8.5 | 8.0 |
| WACC, % | 5.67 | 5.69 | 5.6 | 5.67 | 5.68 | 5.66 | 5.66 | 5.66 | 5.66 | 5.66 |
| PV UFCF | ||||||||||
| SUM PV UFCF | 166.2 | |||||||||
| Long Term Growth Rate, % | 2.00 | |||||||||
| Free cash flow (T + 1) | 8 | |||||||||
| Terminal Value | 224 | |||||||||
| Present Terminal Value | 170 | |||||||||
| Enterprise Value | 336 | |||||||||
| Net Debt | -7 | |||||||||
| Equity Value | 343 | |||||||||
| Diluted Shares Outstanding, MM | 14 | |||||||||
| Equity Value Per Share | 25.03 |
What You Will Get
- Pre-Filled Financial Model: Global Indemnity Group's (GBLI) actual data facilitates accurate DCF valuation.
- Full Forecast Control: Modify revenue growth, margins, WACC, and other essential drivers as needed.
- Instant Calculations: Real-time updates allow you to see results immediately as you adjust inputs.
- Investor-Ready Template: A polished Excel file crafted for high-quality valuation presentations.
- Customizable and Reusable: Designed for adaptability, enabling repeated use for in-depth forecasts.
Key Features
- Comprehensive Data: Global Indemnity Group's historical financial statements and pre-filled projections.
- Customizable Inputs: Modify WACC, tax rates, revenue growth, and underwriting margins.
- Real-Time Results: View Global Indemnity Group’s intrinsic value update instantly.
- Intuitive Visual Outputs: Dashboard graphs illustrate valuation outcomes and essential metrics.
- Designed for Precision: A professional-grade tool for analysts, investors, and finance professionals.
How It Works
- Step 1: Download the prebuilt Excel template featuring Global Indemnity Group, LLC’s (GBLI) data.
- Step 2: Review the pre-filled sheets to familiarize yourself with the essential metrics.
- Step 3: Modify forecasts and assumptions in the editable yellow cells (WACC, growth, margins).
- Step 4: Instantly see the recalculated results, including Global Indemnity Group, LLC’s (GBLI) intrinsic value.
- Step 5: Make informed investment choices or create reports based on the outputs.
Why Choose This Calculator for Global Indemnity Group, LLC (GBLI)?
- Designed for Experts: A sophisticated tool tailored for insurance analysts, financial officers, and industry consultants.
- Comprehensive Data: Historical and projected financials for Global Indemnity preloaded for precise analysis.
- Flexible Scenario Analysis: Effortlessly test various forecasts and assumptions.
- Insightful Outputs: Automatically computes intrinsic value, NPV, and other essential metrics.
- User-Friendly: Step-by-step guidance ensures a seamless experience.
Who Should Use Global Indemnity Group, LLC (GBLI)?
- Insurance Professionals: Enhance your understanding of risk assessment and claims management.
- Investors: Evaluate and track the performance of Global Indemnity Group, LLC (GBLI) within your portfolio.
- Financial Analysts: Utilize comprehensive data to conduct in-depth analyses of GBLI's market positioning.
- Students: Explore real-world applications of insurance principles and financial modeling.
- Business Owners: Learn how insurance strategies can impact your business sustainability and growth.
What the Template Contains
- Historical Data: Includes Global Indemnity Group's (GBLI) past financials and baseline forecasts.
- DCF and Levered DCF Models: Detailed templates to calculate Global Indemnity Group's (GBLI) intrinsic value.
- WACC Sheet: Pre-built calculations for Weighted Average Cost of Capital.
- Editable Inputs: Modify key drivers like growth rates, EBITDA %, and CAPEX assumptions.
- Quarterly and Annual Statements: A complete breakdown of Global Indemnity Group's (GBLI) financials.
- Interactive Dashboard: Visualize valuation results and projections dynamically.
Disclaimer
All information, articles, and product details provided on this website are for general informational and educational purposes only. We do not claim any ownership over, nor do we intend to infringe upon, any trademarks, copyrights, logos, brand names, or other intellectual property mentioned or depicted on this site. Such intellectual property remains the property of its respective owners, and any references here are made solely for identification or informational purposes, without implying any affiliation, endorsement, or partnership.
We make no representations or warranties, express or implied, regarding the accuracy, completeness, or suitability of any content or products presented. Nothing on this website should be construed as legal, tax, investment, financial, medical, or other professional advice. In addition, no part of this site—including articles or product references—constitutes a solicitation, recommendation, endorsement, advertisement, or offer to buy or sell any securities, franchises, or other financial instruments, particularly in jurisdictions where such activity would be unlawful.
All content is of a general nature and may not address the specific circumstances of any individual or entity. It is not a substitute for professional advice or services. Any actions you take based on the information provided here are strictly at your own risk. You accept full responsibility for any decisions or outcomes arising from your use of this website and agree to release us from any liability in connection with your use of, or reliance upon, the content or products found herein.