
|
CGI Inc. (GIB) تقييم DCF |
Fully Editable: Tailor To Your Needs In Excel Or Sheets
Professional Design: Trusted, Industry-Standard Templates
Investor-Approved Valuation Models
MAC/PC Compatible, Fully Unlocked
No Expertise Is Needed; Easy To Follow
CGI Inc. (GIB) Bundle
تحسين اختيارات الاستثمار الخاصة بك مع حاسبة CGI Inc. (GIB) DCF! تحليل البيانات المالية CGI الأصلية ، وضبط تنبؤات النمو والنفقات ، ولاحظ كيف تؤثر التعديلات على القيمة الجوهرية لشركة CGI Inc. في الوقت الفعلي.
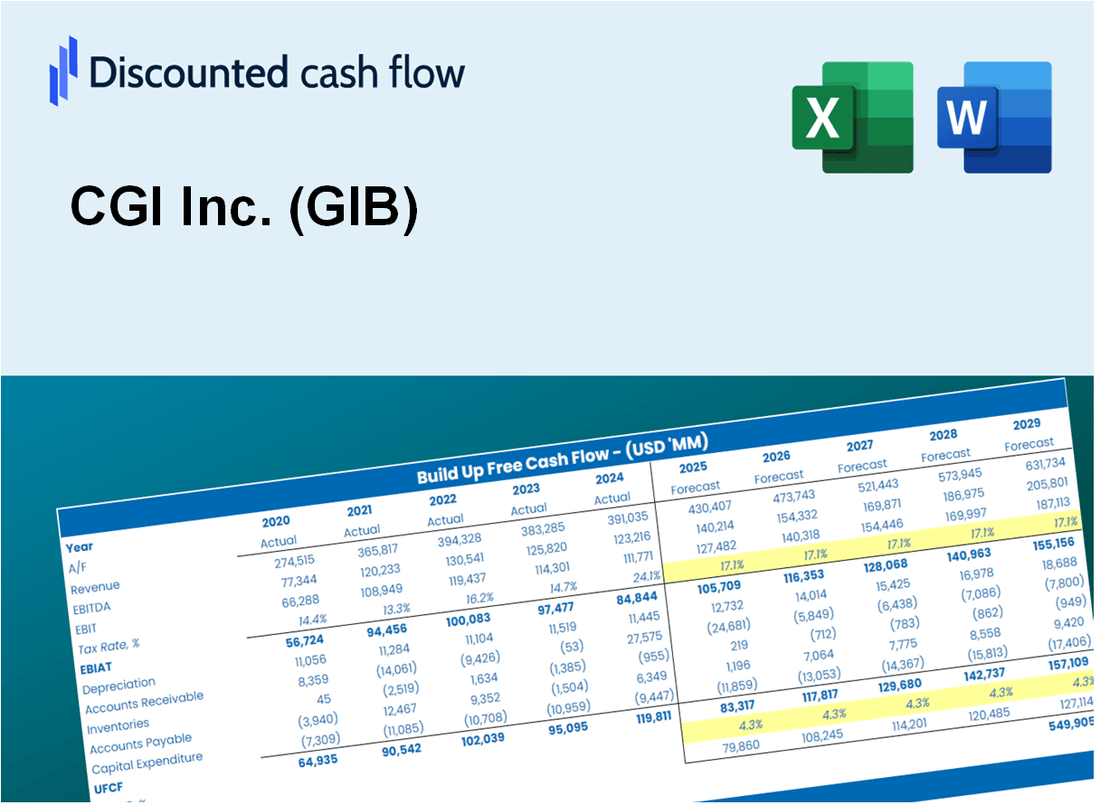
Discounted Cash Flow (DCF) - (USD MM)
| Year | AY1 2021 |
AY2 2022 |
AY3 2023 |
AY4 2024 |
AY5 2025 |
FY1 2026 |
FY2 2027 |
FY3 2028 |
FY4 2029 |
FY5 2030 |
|---|---|---|---|---|---|---|---|---|---|---|
| Revenue | 8,645.5 | 9,086.7 | 10,192.2 | 10,463.0 | 11,344.6 | 12,148.7 | 13,009.7 | 13,931.9 | 14,919.3 | 15,976.8 |
| Revenue Growth, % | 0 | 5.1 | 12.17 | 2.66 | 8.43 | 7.09 | 7.09 | 7.09 | 7.09 | 7.09 |
| EBITDA | 1,747.9 | 1,782.5 | 1,950.7 | 2,012.5 | 1,799.5 | 2,285.6 | 2,447.6 | 2,621.1 | 2,806.9 | 3,005.8 |
| EBITDA, % | 20.22 | 19.62 | 19.14 | 19.23 | 15.86 | 18.81 | 18.81 | 18.81 | 18.81 | 18.81 |
| Depreciation | 364.0 | 327.3 | 321.1 | 318.8 | 153.5 | 373.3 | 399.7 | 428.1 | 458.4 | 490.9 |
| Depreciation, % | 4.21 | 3.6 | 3.15 | 3.05 | 1.35 | 3.07 | 3.07 | 3.07 | 3.07 | 3.07 |
| EBIT | 1,383.9 | 1,455.1 | 1,629.5 | 1,693.7 | 1,645.9 | 1,912.3 | 2,047.9 | 2,193.0 | 2,348.5 | 2,514.9 |
| EBIT, % | 16.01 | 16.01 | 15.99 | 16.19 | 14.51 | 15.74 | 15.74 | 15.74 | 15.74 | 15.74 |
| Total Cash | 1,224.9 | 713.2 | 1,123.3 | 1,044.0 | 618.7 | 1,177.7 | 1,261.2 | 1,350.6 | 1,446.3 | 1,548.8 |
| Total Cash, percent | .0 | .0 | .0 | .0 | .0 | .0 | .0 | .0 | .0 | .0 |
| Account Receivables | 881.5 | 975.8 | 1,020.3 | 1,013.5 | 1,932.9 | 1,401.2 | 1,500.5 | 1,606.9 | 1,720.8 | 1,842.8 |
| Account Receivables, % | 10.2 | 10.74 | 10.01 | 9.69 | 17.04 | 11.53 | 11.53 | 11.53 | 11.53 | 11.53 |
| Inventories | 745.0 | 849.7 | .0 | 861.3 | .0 | 636.6 | 681.7 | 730.0 | 781.8 | 837.2 |
| Inventories, % | 8.62 | 9.35 | 0 | 8.23 | 0 | 5.24 | 5.24 | 5.24 | 5.24 | 5.24 |
| Accounts Payable | 635.5 | 724.6 | 659.2 | 712.8 | 723.5 | 850.0 | 910.2 | 974.7 | 1,043.8 | 1,117.8 |
| Accounts Payable, % | 7.35 | 7.97 | 6.47 | 6.81 | 6.38 | 7 | 7 | 7 | 7 | 7 |
| Capital Expenditure | -168.1 | -209.4 | -218.8 | -188.0 | -83.1 | -216.9 | -232.2 | -248.7 | -266.3 | -285.2 |
| Capital Expenditure, % | -1.94 | -2.3 | -2.15 | -1.8 | -0.73282 | -1.79 | -1.79 | -1.79 | -1.79 | -1.79 |
| Tax Rate, % | 26.04 | 26.04 | 26.04 | 26.04 | 26.04 | 26.04 | 26.04 | 26.04 | 26.04 | 26.04 |
| EBITAT | 1,030.8 | 1,084.6 | 1,209.4 | 1,251.4 | 1,217.3 | 1,419.3 | 1,519.9 | 1,627.6 | 1,743.0 | 1,866.5 |
| Depreciation | ||||||||||
| Changes in Account Receivables | ||||||||||
| Changes in Inventories | ||||||||||
| Changes in Accounts Payable | ||||||||||
| Capital Expenditure | ||||||||||
| UFCF | 235.7 | 1,092.7 | 2,051.4 | 581.4 | 1,240.3 | 1,597.3 | 1,603.2 | 1,716.8 | 1,838.5 | 1,968.8 |
| WACC, % | 5.08 | 5.08 | 5.07 | 5.07 | 5.07 | 5.07 | 5.07 | 5.07 | 5.07 | 5.07 |
| PV UFCF | ||||||||||
| SUM PV UFCF | 7,497.6 | |||||||||
| Long Term Growth Rate, % | 2.00 | |||||||||
| Free cash flow (T + 1) | 2,008 | |||||||||
| Terminal Value | 65,318 | |||||||||
| Present Terminal Value | 50,997 | |||||||||
| Enterprise Value | 58,495 | |||||||||
| Net Debt | 2,571 | |||||||||
| Equity Value | 55,924 | |||||||||
| Diluted Shares Outstanding, MM | 225 | |||||||||
| Equity Value Per Share | 248.01 |
What You Will Get
- Comprehensive GIB Financials: Access to historical and projected data for precise valuation.
- Customizable Inputs: Adjust WACC, tax rates, revenue growth, and capital expenditures to fit your analysis.
- Real-Time Calculations: Intrinsic value and NPV are computed automatically as you modify inputs.
- Scenario Analysis: Explore various scenarios to assess CGI Inc.'s future performance.
- User-Friendly Interface: Designed for professionals while remaining easy for newcomers to navigate.
Key Features
- Comprehensive Financial Data: CGI Inc.'s historical financial statements and pre-populated forecasts.
- Customizable Variables: Adjust WACC, tax rates, revenue growth, and EBITDA margins as needed.
- Real-Time Valuation: Instantly view CGI Inc.'s intrinsic value recalculating live.
- Intuitive Visualizations: Dashboard graphs illustrate valuation outcomes and essential metrics.
- Designed for Precision: A reliable tool for analysts, investors, and finance professionals.
How It Works
- 1. Download the Model: Obtain and open the Excel file containing CGI Inc.'s (GIB) financial data.
- 2. Adjust Key Inputs: Modify essential parameters such as revenue growth, discount rates, and capital investments.
- 3. Analyze Results in Real-Time: The DCF model automatically computes the intrinsic value and net present value (NPV).
- 4. Explore Different Scenarios: Evaluate various projections to understand diverse valuation possibilities.
- 5. Make Informed Decisions: Deliver professional valuation analyses to back your strategic choices.
Why Choose This Calculator for CGI Inc. (GIB)?
- User-Friendly Interface: Tailored for both novices and seasoned professionals.
- Customizable Inputs: Adjust parameters easily to suit your analytical needs.
- Real-Time Feedback: Observe immediate updates to CGI Inc.'s valuation as you modify inputs.
- Preloaded Data: Comes equipped with CGI Inc.'s actual financial information for swift evaluations.
- Relied Upon by Experts: Favored by investors and analysts for making well-informed choices.
Who Should Use This Product?
- Individual Investors: Make informed decisions about buying or selling CGI Inc. (GIB) stock.
- Financial Analysts: Enhance valuation processes with pre-built financial models tailored for CGI Inc. (GIB).
- Consultants: Provide clients with professional valuation insights on CGI Inc. (GIB) swiftly and accurately.
- Business Owners: Gain insights into how companies like CGI Inc. (GIB) are valued to inform your own business strategy.
- Finance Students: Master valuation techniques through the analysis of real-world data involving CGI Inc. (GIB).
What the Template Contains
- Preloaded GIB Data: Historical and projected financial data, including revenue, EBIT, and capital expenditures.
- DCF and WACC Models: Professional-grade sheets for calculating intrinsic value and Weighted Average Cost of Capital.
- Editable Inputs: Yellow-highlighted cells for adjusting revenue growth, tax rates, and discount rates.
- Financial Statements: Comprehensive annual and quarterly financials for deeper analysis.
- Key Ratios: Profitability, leverage, and efficiency ratios to evaluate performance.
- Dashboard and Charts: Visual summaries of valuation outcomes and assumptions.
Disclaimer
All information, articles, and product details provided on this website are for general informational and educational purposes only. We do not claim any ownership over, nor do we intend to infringe upon, any trademarks, copyrights, logos, brand names, or other intellectual property mentioned or depicted on this site. Such intellectual property remains the property of its respective owners, and any references here are made solely for identification or informational purposes, without implying any affiliation, endorsement, or partnership.
We make no representations or warranties, express or implied, regarding the accuracy, completeness, or suitability of any content or products presented. Nothing on this website should be construed as legal, tax, investment, financial, medical, or other professional advice. In addition, no part of this site—including articles or product references—constitutes a solicitation, recommendation, endorsement, advertisement, or offer to buy or sell any securities, franchises, or other financial instruments, particularly in jurisdictions where such activity would be unlawful.
All content is of a general nature and may not address the specific circumstances of any individual or entity. It is not a substitute for professional advice or services. Any actions you take based on the information provided here are strictly at your own risk. You accept full responsibility for any decisions or outcomes arising from your use of this website and agree to release us from any liability in connection with your use of, or reliance upon, the content or products found herein.