
|
التقييم العالمي للشركة الصناعية (GIC) DCF |
Fully Editable: Tailor To Your Needs In Excel Or Sheets
Professional Design: Trusted, Industry-Standard Templates
Investor-Approved Valuation Models
MAC/PC Compatible, Fully Unlocked
No Expertise Is Needed; Easy To Follow
Global Industrial Company (GIC) Bundle
اكتساب نظرة ثاقبة على تحليل التقييم العالمي لشركتك الصناعية (GIC) مع حاسبة DCF المتطورة! تم تحميله مسبقًا ببيانات حقيقية (GIC) ، يمكّنك هذا القالب Excel من ضبط التوقعات والافتراضات لتحديد القيمة الجوهرية للشركة الصناعية العالمية بدقة.
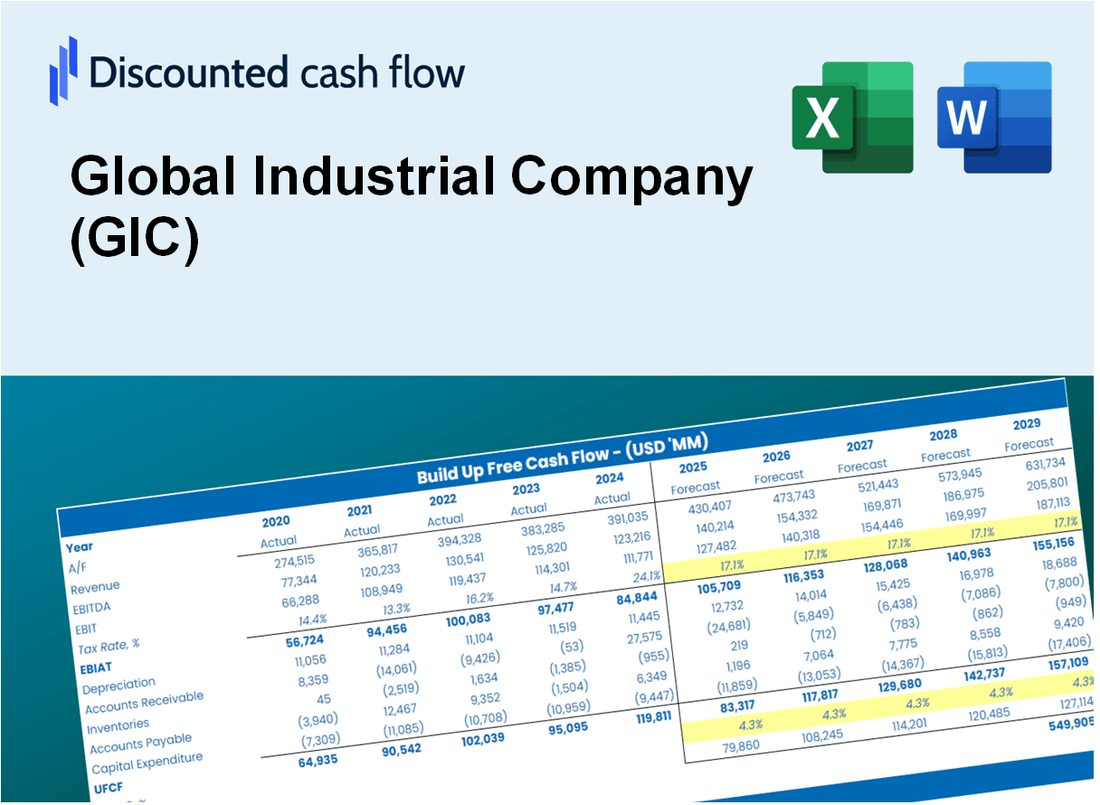
Discounted Cash Flow (DCF) - (USD MM)
| Year | AY1 2020 |
AY2 2021 |
AY3 2022 |
AY4 2023 |
AY5 2024 |
FY1 2025 |
FY2 2026 |
FY3 2027 |
FY4 2028 |
FY5 2029 |
|---|---|---|---|---|---|---|---|---|---|---|
| Revenue | 1,029.0 | 1,063.1 | 1,166.1 | 1,274.3 | 1,315.9 | 1,399.9 | 1,489.3 | 1,584.5 | 1,685.7 | 1,793.3 |
| Revenue Growth, % | 0 | 3.31 | 9.69 | 9.28 | 3.26 | 6.39 | 6.39 | 6.39 | 6.39 | 6.39 |
| EBITDA | 88.2 | 91.7 | 109.1 | 102.7 | 87.6 | 115.5 | 122.9 | 130.8 | 139.1 | 148.0 |
| EBITDA, % | 8.57 | 8.63 | 9.36 | 8.06 | 6.66 | 8.25 | 8.25 | 8.25 | 8.25 | 8.25 |
| Depreciation | 4.1 | 3.7 | 3.9 | 6.4 | 7.6 | 6.0 | 6.4 | 6.8 | 7.3 | 7.7 |
| Depreciation, % | 0.39845 | 0.34804 | 0.33445 | 0.50224 | 0.57755 | 0.43214 | 0.43214 | 0.43214 | 0.43214 | 0.43214 |
| EBIT | 84.1 | 88.0 | 105.2 | 96.3 | 80.0 | 109.5 | 116.5 | 123.9 | 131.8 | 140.3 |
| EBIT, % | 8.17 | 8.28 | 9.02 | 7.56 | 6.08 | 7.82 | 7.82 | 7.82 | 7.82 | 7.82 |
| Total Cash | 22.4 | 15.4 | 28.5 | 34.4 | 44.6 | 34.0 | 36.2 | 38.5 | 41.0 | 43.6 |
| Total Cash, percent | .0 | .0 | .0 | .0 | .0 | .0 | .0 | .0 | .0 | .0 |
| Account Receivables | 102.3 | 106.8 | 108.0 | 130.7 | 126.5 | 137.5 | 146.3 | 155.7 | 165.6 | 176.2 |
| Account Receivables, % | 9.94 | 10.05 | 9.26 | 10.26 | 9.61 | 9.82 | 9.82 | 9.82 | 9.82 | 9.82 |
| Inventories | 132.3 | 172.8 | 179.4 | 150.8 | 167.1 | 193.3 | 205.6 | 218.7 | 232.7 | 247.6 |
| Inventories, % | 12.86 | 16.25 | 15.38 | 11.83 | 12.7 | 13.81 | 13.81 | 13.81 | 13.81 | 13.81 |
| Accounts Payable | 125.4 | 114.4 | 96.9 | 111.0 | 106.5 | 134.6 | 143.2 | 152.3 | 162.0 | 172.4 |
| Accounts Payable, % | 12.19 | 10.76 | 8.31 | 8.71 | 8.09 | 9.61 | 9.61 | 9.61 | 9.61 | 9.61 |
| Capital Expenditure | -2.7 | -3.4 | -7.4 | -3.9 | -3.8 | -5.1 | -5.4 | -5.7 | -6.1 | -6.5 |
| Capital Expenditure, % | -0.26239 | -0.31982 | -0.63459 | -0.30605 | -0.28878 | -0.36233 | -0.36233 | -0.36233 | -0.36233 | -0.36233 |
| Tax Rate, % | 23.56 | 23.56 | 23.56 | 23.56 | 23.56 | 23.56 | 23.56 | 23.56 | 23.56 | 23.56 |
| EBITAT | 65.5 | 70.4 | 79.9 | 71.5 | 61.2 | 84.2 | 89.6 | 95.3 | 101.4 | 107.9 |
| Depreciation | ||||||||||
| Changes in Account Receivables | ||||||||||
| Changes in Inventories | ||||||||||
| Changes in Accounts Payable | ||||||||||
| Capital Expenditure | ||||||||||
| UFCF | -42.3 | 14.7 | 51.1 | 94.0 | 48.4 | 76.0 | 78.1 | 83.1 | 88.4 | 94.0 |
| WACC, % | 7.38 | 7.38 | 7.37 | 7.37 | 7.37 | 7.37 | 7.37 | 7.37 | 7.37 | 7.37 |
| PV UFCF | ||||||||||
| SUM PV UFCF | 338.1 | |||||||||
| Long Term Growth Rate, % | 2.00 | |||||||||
| Free cash flow (T + 1) | 96 | |||||||||
| Terminal Value | 1,785 | |||||||||
| Present Terminal Value | 1,251 | |||||||||
| Enterprise Value | 1,589 | |||||||||
| Net Debt | 39 | |||||||||
| Equity Value | 1,550 | |||||||||
| Diluted Shares Outstanding, MM | 38 | |||||||||
| Equity Value Per Share | 40.37 |
What You Will Get
- Real GIC Financial Data: Pre-filled with Global Industrial Company's historical and projected data for accurate analysis.
- Fully Editable Template: Easily modify key inputs such as revenue growth, WACC, and EBITDA %.
- Automatic Calculations: Witness GIC's intrinsic value update in real-time based on your modifications.
- Professional Valuation Tool: Tailored for investors, analysts, and consultants aiming for precise DCF results.
- User-Friendly Design: Intuitive structure and straightforward instructions suitable for all experience levels.
Key Features
- Comprehensive Data: Global Industrial Company's historical financial statements and pre-filled projections.
- Customizable Inputs: Adjust WACC, tax rates, revenue growth, and EBITDA margins as needed.
- Real-Time Results: View Global Industrial Company's intrinsic value recalculating instantly.
- Intuitive Visual Outputs: Dashboard charts illustrate valuation results and essential metrics.
- Designed for Precision: A professional-grade tool for analysts, investors, and finance professionals.
How It Works
- Step 1: Download the Excel file.
- Step 2: Review pre-entered Global Industrial Company (GIC) data (historical and projected).
- Step 3: Adjust key assumptions (yellow cells) based on your analysis.
- Step 4: View automatic recalculations for Global Industrial Company (GIC)’s intrinsic value.
- Step 5: Use the outputs for investment decisions or reporting.
Why Choose This Calculator for Global Industrial Company (GIC)?
- User-Friendly Interface: Tailored for both novice users and seasoned professionals.
- Customizable Inputs: Adjust parameters easily to suit your specific analysis needs.
- Real-Time Valuation: Watch as Global Industrial Company’s valuation updates instantly with input changes.
- Preloaded Financial Data: Comes with GIC’s actual financial metrics for immediate evaluation.
- Relied Upon by Experts: Favored by investors and analysts for making strategic decisions.
Who Should Use This Product?
- Individual Investors: Make informed decisions about buying or selling Global Industrial Company (GIC) stock.
- Financial Analysts: Streamline valuation processes with ready-to-use financial models for Global Industrial Company (GIC).
- Consultants: Deliver professional valuation insights on Global Industrial Company (GIC) to clients quickly and accurately.
- Business Owners: Understand how large companies like Global Industrial Company (GIC) are valued to guide your own strategy.
- Finance Students: Learn valuation techniques using real-world data and scenarios related to Global Industrial Company (GIC).
What the Template Contains
- Comprehensive DCF Model: Editable template with detailed valuation calculations tailored for Global Industrial Company (GIC).
- Real-World Data: GIC’s historical and projected financials preloaded for in-depth analysis.
- Customizable Parameters: Adjust WACC, growth rates, and tax assumptions to explore various scenarios.
- Financial Statements: Complete annual and quarterly breakdowns for enhanced insights.
- Key Ratios: Integrated analysis for profitability, efficiency, and leverage specific to GIC.
- Dashboard with Visual Outputs: Charts and tables designed for clear, actionable results regarding GIC.
Disclaimer
All information, articles, and product details provided on this website are for general informational and educational purposes only. We do not claim any ownership over, nor do we intend to infringe upon, any trademarks, copyrights, logos, brand names, or other intellectual property mentioned or depicted on this site. Such intellectual property remains the property of its respective owners, and any references here are made solely for identification or informational purposes, without implying any affiliation, endorsement, or partnership.
We make no representations or warranties, express or implied, regarding the accuracy, completeness, or suitability of any content or products presented. Nothing on this website should be construed as legal, tax, investment, financial, medical, or other professional advice. In addition, no part of this site—including articles or product references—constitutes a solicitation, recommendation, endorsement, advertisement, or offer to buy or sell any securities, franchises, or other financial instruments, particularly in jurisdictions where such activity would be unlawful.
All content is of a general nature and may not address the specific circumstances of any individual or entity. It is not a substitute for professional advice or services. Any actions you take based on the information provided here are strictly at your own risk. You accept full responsibility for any decisions or outcomes arising from your use of this website and agree to release us from any liability in connection with your use of, or reliance upon, the content or products found herein.