
|
Corning Incorporated (GLW) تقييم DCF |
Fully Editable: Tailor To Your Needs In Excel Or Sheets
Professional Design: Trusted, Industry-Standard Templates
Investor-Approved Valuation Models
MAC/PC Compatible, Fully Unlocked
No Expertise Is Needed; Easy To Follow
Corning Incorporated (GLW) Bundle
تبسيط تحليلك وتحسين الدقة من خلال حاسبة Corning Incorporated (GLW) DCF! باستخدام بيانات حقيقية من الافتراضات القابلة للتخصيص ، تمكنك هذه الأداة من التنبؤ وتحليل وتقييم Corning Incorporated (GLW) تمامًا مثل المستثمر المخضرم.
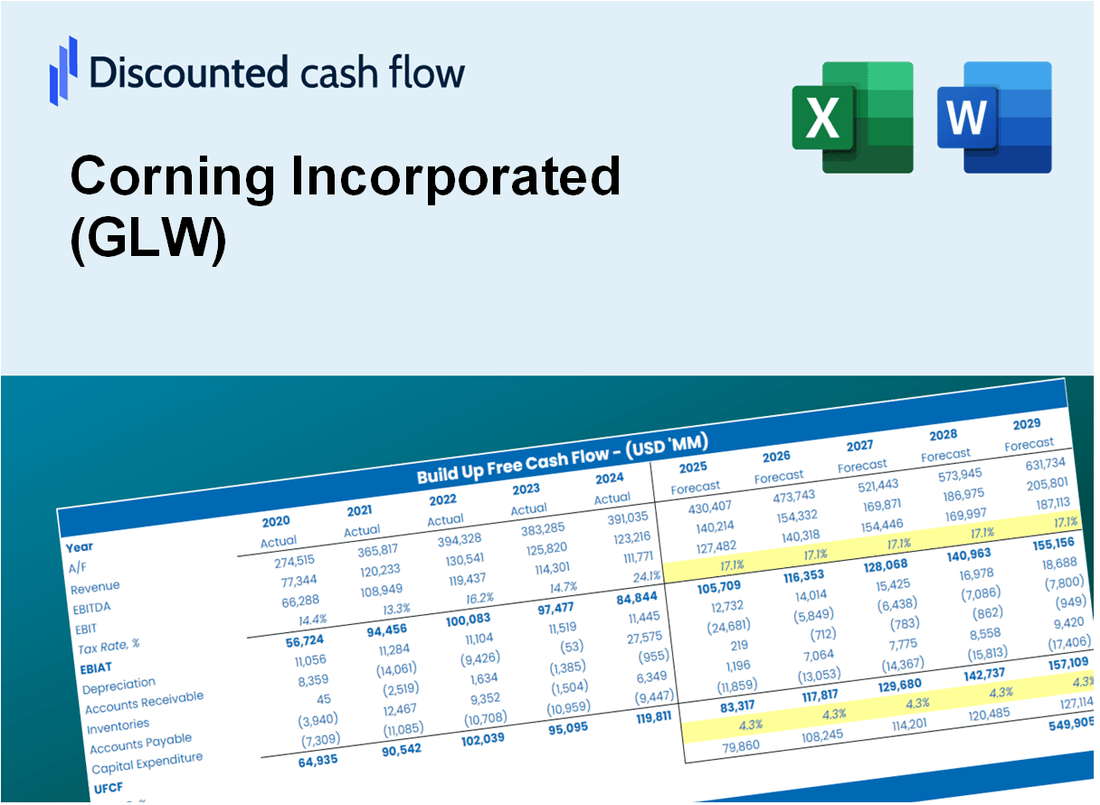
Discounted Cash Flow (DCF) - (USD MM)
| Year | AY1 2020 |
AY2 2021 |
AY3 2022 |
AY4 2023 |
AY5 2024 |
FY1 2025 |
FY2 2026 |
FY3 2027 |
FY4 2028 |
FY5 2029 |
|---|---|---|---|---|---|---|---|---|---|---|
| Revenue | 11,303.0 | 14,082.0 | 14,189.0 | 12,588.0 | 13,118.0 | 13,717.3 | 14,343.9 | 14,999.2 | 15,684.4 | 16,400.9 |
| Revenue Growth, % | 0 | 24.59 | 0.75984 | -11.28 | 4.21 | 4.57 | 4.57 | 4.57 | 4.57 | 4.57 |
| EBITDA | 2,419.0 | 4,207.0 | 3,541.0 | 2,514.0 | 2,492.0 | 3,160.5 | 3,304.9 | 3,455.8 | 3,613.7 | 3,778.8 |
| EBITDA, % | 21.4 | 29.88 | 24.96 | 19.97 | 19 | 23.04 | 23.04 | 23.04 | 23.04 | 23.04 |
| Depreciation | 1,520.0 | 1,481.0 | 1,452.0 | 1,369.0 | 1,350.0 | 1,518.9 | 1,588.3 | 1,660.8 | 1,736.7 | 1,816.1 |
| Depreciation, % | 13.45 | 10.52 | 10.23 | 10.88 | 10.29 | 11.07 | 11.07 | 11.07 | 11.07 | 11.07 |
| EBIT | 899.0 | 2,726.0 | 2,089.0 | 1,145.0 | 1,142.0 | 1,641.6 | 1,716.6 | 1,795.0 | 1,877.0 | 1,962.7 |
| EBIT, % | 7.95 | 19.36 | 14.72 | 9.1 | 8.71 | 11.97 | 11.97 | 11.97 | 11.97 | 11.97 |
| Total Cash | 2,672.0 | 2,148.0 | 1,671.0 | 1,779.0 | 1,768.0 | 2,147.6 | 2,245.7 | 2,348.3 | 2,455.6 | 2,567.7 |
| Total Cash, percent | .0 | .0 | .0 | .0 | .0 | .0 | .0 | .0 | .0 | .0 |
| Account Receivables | 2,133.0 | 2,004.0 | 1,721.0 | 1,572.0 | 2,053.0 | 2,012.9 | 2,104.8 | 2,201.0 | 2,301.5 | 2,406.7 |
| Account Receivables, % | 18.87 | 14.23 | 12.13 | 12.49 | 15.65 | 14.67 | 14.67 | 14.67 | 14.67 | 14.67 |
| Inventories | 2,438.0 | 2,481.0 | 2,904.0 | 2,666.0 | 2,724.0 | 2,787.3 | 2,914.6 | 3,047.8 | 3,187.0 | 3,332.6 |
| Inventories, % | 21.57 | 17.62 | 20.47 | 21.18 | 20.77 | 20.32 | 20.32 | 20.32 | 20.32 | 20.32 |
| Accounts Payable | 1,174.0 | 1,612.0 | 1,804.0 | 1,466.0 | 1,472.0 | 1,575.2 | 1,647.1 | 1,722.4 | 1,801.0 | 1,883.3 |
| Accounts Payable, % | 10.39 | 11.45 | 12.71 | 11.65 | 11.22 | 11.48 | 11.48 | 11.48 | 11.48 | 11.48 |
| Capital Expenditure | -1,377.0 | -1,637.0 | -1,604.0 | -1,390.0 | -965.0 | -1,468.0 | -1,535.1 | -1,605.2 | -1,678.6 | -1,755.2 |
| Capital Expenditure, % | -12.18 | -11.62 | -11.3 | -11.04 | -7.36 | -10.7 | -10.7 | -10.7 | -10.7 | -10.7 |
| Tax Rate, % | 37.76 | 37.76 | 37.76 | 37.76 | 37.76 | 37.76 | 37.76 | 37.76 | 37.76 | 37.76 |
| EBITAT | 738.8 | 2,141.7 | 1,529.8 | 815.3 | 710.8 | 1,206.3 | 1,261.4 | 1,319.0 | 1,379.3 | 1,442.3 |
| Depreciation | ||||||||||
| Changes in Account Receivables | ||||||||||
| Changes in Inventories | ||||||||||
| Changes in Accounts Payable | ||||||||||
| Capital Expenditure | ||||||||||
| UFCF | -2,515.2 | 2,509.7 | 1,429.8 | 843.3 | 562.8 | 1,337.2 | 1,167.3 | 1,220.6 | 1,276.4 | 1,334.7 |
| WACC, % | 8.37 | 8.36 | 8.34 | 8.33 | 8.29 | 8.34 | 8.34 | 8.34 | 8.34 | 8.34 |
| PV UFCF | ||||||||||
| SUM PV UFCF | 5,009.3 | |||||||||
| Long Term Growth Rate, % | 4.00 | |||||||||
| Free cash flow (T + 1) | 1,388 | |||||||||
| Terminal Value | 31,992 | |||||||||
| Present Terminal Value | 21,435 | |||||||||
| Enterprise Value | 26,445 | |||||||||
| Net Debt | 6,323 | |||||||||
| Equity Value | 20,122 | |||||||||
| Diluted Shares Outstanding, MM | 869 | |||||||||
| Equity Value Per Share | 23.15 |
What You Will Get
- Real GLW Financial Data: Pre-filled with Corning Incorporated’s historical and projected data for precise analysis.
- Fully Editable Template: Modify key inputs like revenue growth, WACC, and EBITDA % with ease.
- Automatic Calculations: See Corning’s intrinsic value update instantly based on your changes.
- Professional Valuation Tool: Designed for investors, analysts, and consultants seeking accurate DCF results.
- User-Friendly Design: Simple structure and clear instructions for all experience levels.
Key Features
- Authentic Corning Financials: Gain access to precise historical data and future forecasts tailored for Corning Incorporated (GLW).
- Adjustable Forecast Parameters: Modify highlighted cells for key metrics such as WACC, growth rates, and profit margins.
- Real-Time Calculations: Enjoy automatic updates for DCF, Net Present Value (NPV), and cash flow assessments.
- Interactive Dashboard: Utilize clear charts and summaries to effectively visualize your valuation outcomes.
- Designed for All Users: An intuitive layout suitable for investors, CFOs, and consultants alike.
How It Works
- Download: Obtain the pre-built Excel file featuring Corning Incorporated’s (GLW) financial data.
- Customize: Modify projections, including revenue growth, EBITDA %, and WACC.
- Update Automatically: Watch as intrinsic value and NPV calculations refresh in real-time.
- Test Scenarios: Generate various forecasts and instantly compare results.
- Make Decisions: Leverage the valuation findings to shape your investment approach.
Why Choose This Calculator for Corning Incorporated (GLW)?
- Designed for Experts: A sophisticated tool utilized by financial analysts, CFOs, and industry consultants.
- Accurate Data: Corning’s historical and projected financials are preloaded for precision.
- What-If Analysis: Effortlessly simulate various projections and assumptions.
- Comprehensive Outputs: Instantly computes intrinsic value, NPV, and essential financial metrics.
- User-Friendly: Detailed instructions lead you through each step of the calculation.
Who Should Use This Product?
- Finance Students: Discover valuation methodologies and apply them with real-world data for Corning Incorporated (GLW).
- Academics: Integrate industry-standard models into your lectures or research focused on Corning Incorporated (GLW).
- Investors: Validate your investment strategies and evaluate valuation scenarios for Corning Incorporated (GLW).
- Analysts: Enhance your analysis process with a ready-to-use, customizable DCF model tailored for Corning Incorporated (GLW).
- Small Business Owners: Understand the analytical approaches used for evaluating large public firms like Corning Incorporated (GLW).
What the Corning Template Contains
- Comprehensive DCF Model: Editable template featuring detailed valuation calculations.
- Real-World Data: Corning's historical and projected financials preloaded for analysis.
- Customizable Parameters: Adjust WACC, growth rates, and tax assumptions to explore different scenarios.
- Financial Statements: Complete annual and quarterly breakdowns for in-depth insights.
- Key Ratios: Integrated analysis for profitability, efficiency, and leverage metrics.
- Dashboard with Visual Outputs: Charts and tables that provide clear, actionable results.
Disclaimer
All information, articles, and product details provided on this website are for general informational and educational purposes only. We do not claim any ownership over, nor do we intend to infringe upon, any trademarks, copyrights, logos, brand names, or other intellectual property mentioned or depicted on this site. Such intellectual property remains the property of its respective owners, and any references here are made solely for identification or informational purposes, without implying any affiliation, endorsement, or partnership.
We make no representations or warranties, express or implied, regarding the accuracy, completeness, or suitability of any content or products presented. Nothing on this website should be construed as legal, tax, investment, financial, medical, or other professional advice. In addition, no part of this site—including articles or product references—constitutes a solicitation, recommendation, endorsement, advertisement, or offer to buy or sell any securities, franchises, or other financial instruments, particularly in jurisdictions where such activity would be unlawful.
All content is of a general nature and may not address the specific circumstances of any individual or entity. It is not a substitute for professional advice or services. Any actions you take based on the information provided here are strictly at your own risk. You accept full responsibility for any decisions or outcomes arising from your use of this website and agree to release us from any liability in connection with your use of, or reliance upon, the content or products found herein.