
|
شحن Genco & تقييم التداول المحدودة (GNK) DCF |
Fully Editable: Tailor To Your Needs In Excel Or Sheets
Professional Design: Trusted, Industry-Standard Templates
Investor-Approved Valuation Models
MAC/PC Compatible, Fully Unlocked
No Expertise Is Needed; Easy To Follow
Genco Shipping & Trading Limited (GNK) Bundle
استكشاف الآفاق المالية لشحن Genco & Trading Limited (GNK) مع حاسبة DCF سهلة الاستخدام لدينا! أدخل افتراضاتك للنمو والهوامش والمصروفات لحساب القيمة الجوهرية لشحن Genco & Trading Limited (GNK) وتشكيل استراتيجية الاستثمار الخاصة بك.
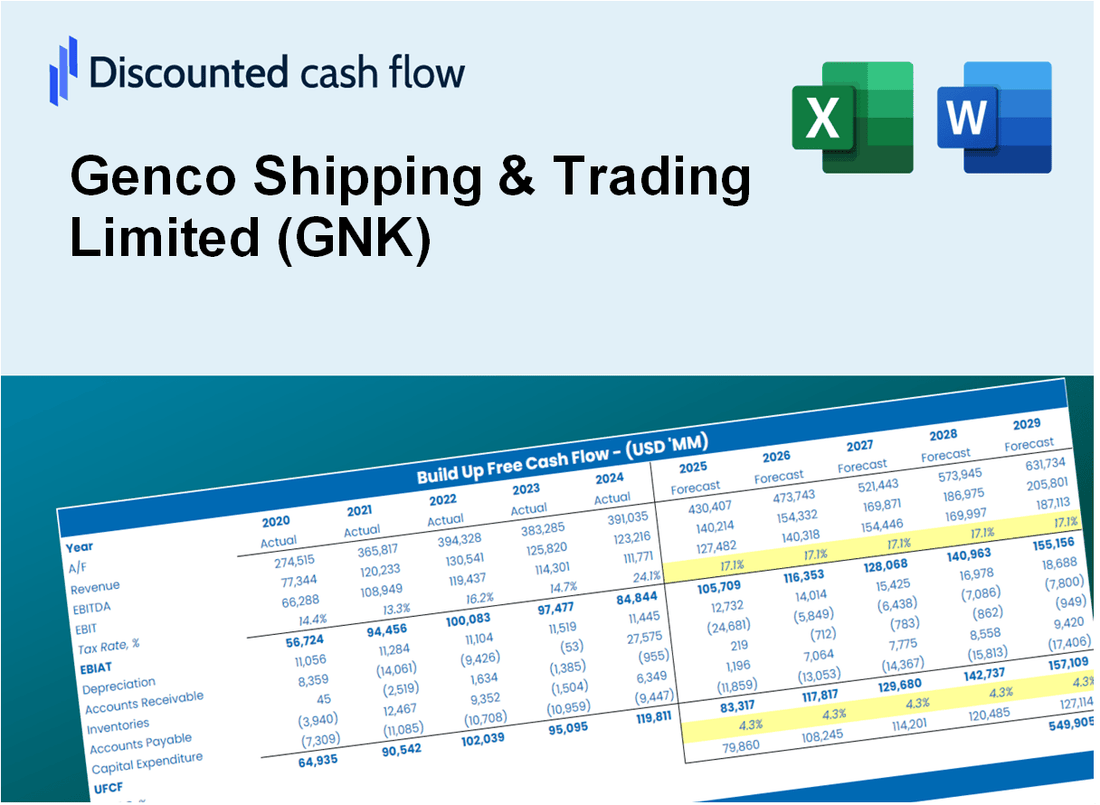
Discounted Cash Flow (DCF) - (USD MM)
| Year | AY1 2020 |
AY2 2021 |
AY3 2022 |
AY4 2023 |
AY5 2024 |
FY1 2025 |
FY2 2026 |
FY3 2027 |
FY4 2028 |
FY5 2029 |
|---|---|---|---|---|---|---|---|---|---|---|
| Revenue | 355.6 | 547.1 | 536.9 | 383.8 | 423.0 | 458.7 | 497.3 | 539.2 | 584.7 | 633.9 |
| Revenue Growth, % | 0 | 53.88 | -1.86 | -28.52 | 10.21 | 8.43 | 8.43 | 8.43 | 8.43 | 8.43 |
| EBITDA | -136.6 | 255.0 | 230.1 | 60.6 | 159.9 | 96.0 | 104.1 | 112.8 | 122.3 | 132.6 |
| EBITDA, % | -38.43 | 46.61 | 42.85 | 15.79 | 37.79 | 20.92 | 20.92 | 20.92 | 20.92 | 20.92 |
| Depreciation | 66.5 | 57.6 | 61.6 | 67.9 | 70.1 | 68.8 | 74.6 | 80.9 | 87.7 | 95.1 |
| Depreciation, % | 18.71 | 10.53 | 11.47 | 17.69 | 16.57 | 15 | 15 | 15 | 15 | 15 |
| EBIT | -203.2 | 197.4 | 168.5 | -7.3 | 89.8 | 27.2 | 29.5 | 32.0 | 34.7 | 37.6 |
| EBIT, % | -57.14 | 36.08 | 31.37 | -1.9 | 21.22 | 5.93 | 5.93 | 5.93 | 5.93 | 5.93 |
| Total Cash | 143.9 | 114.6 | 58.1 | 46.5 | 43.7 | 86.9 | 94.2 | 102.1 | 110.7 | 120.1 |
| Total Cash, percent | .0 | .0 | .0 | .0 | .0 | .0 | .0 | .0 | .0 | .0 |
| Account Receivables | 13.0 | 20.1 | 26.5 | 19.2 | 22.1 | 20.6 | 22.4 | 24.3 | 26.3 | 28.5 |
| Account Receivables, % | 3.65 | 3.68 | 4.94 | 5.01 | 5.22 | 4.5 | 4.5 | 4.5 | 4.5 | 4.5 |
| Inventories | 21.6 | 24.6 | 21.6 | 26.7 | 22.2 | 24.6 | 26.7 | 28.9 | 31.3 | 34.0 |
| Inventories, % | 6.07 | 4.49 | 4.02 | 6.97 | 5.26 | 5.36 | 5.36 | 5.36 | 5.36 | 5.36 |
| Accounts Payable | 11.9 | 9.4 | 16.2 | 10.7 | 17.5 | 13.7 | 14.9 | 16.1 | 17.5 | 19.0 |
| Accounts Payable, % | 3.34 | 1.72 | 3.01 | 2.77 | 4.13 | 2.99 | 2.99 | 2.99 | 2.99 | 2.99 |
| Capital Expenditure | -20.0 | -117.5 | -56.0 | -94.0 | -56.7 | -69.2 | -75.0 | -81.4 | -88.2 | -95.6 |
| Capital Expenditure, % | -5.64 | -21.47 | -10.44 | -24.49 | -13.4 | -15.09 | -15.09 | -15.09 | -15.09 | -15.09 |
| Tax Rate, % | 0.12419 | 0.12419 | 0.12419 | 0.12419 | 0.12419 | 0.12419 | 0.12419 | 0.12419 | 0.12419 | 0.12419 |
| EBITAT | -222.6 | 197.4 | 167.6 | -7.6 | 89.7 | 27.1 | 29.4 | 31.9 | 34.6 | 37.5 |
| Depreciation | ||||||||||
| Changes in Account Receivables | ||||||||||
| Changes in Inventories | ||||||||||
| Changes in Accounts Payable | ||||||||||
| Capital Expenditure | ||||||||||
| UFCF | -198.8 | 124.9 | 176.5 | -37.1 | 111.6 | 22.1 | 26.3 | 28.6 | 31.0 | 33.6 |
| WACC, % | 9.84 | 9.84 | 9.83 | 9.84 | 9.83 | 9.83 | 9.83 | 9.83 | 9.83 | 9.83 |
| PV UFCF | ||||||||||
| SUM PV UFCF | 105.8 | |||||||||
| Long Term Growth Rate, % | 0.50 | |||||||||
| Free cash flow (T + 1) | 34 | |||||||||
| Terminal Value | 361 | |||||||||
| Present Terminal Value | 226 | |||||||||
| Enterprise Value | 332 | |||||||||
| Net Debt | 46 | |||||||||
| Equity Value | 286 | |||||||||
| Diluted Shares Outstanding, MM | 44 | |||||||||
| Equity Value Per Share | 6.56 |
What You Will Get
- Accurate GNK Financials: Access to both historical and projected data for precise valuation.
- Customizable Parameters: Adjust WACC, tax rates, revenue growth, and capital expenditures to fit your analysis.
- Instant Calculations: Intrinsic value and NPV are computed in real-time.
- Scenario Testing: Evaluate various scenarios to assess Genco Shipping's future performance.
- User-Friendly Interface: Designed for industry experts while remaining approachable for newcomers.
Key Features
- Comprehensive DCF Calculator: Features detailed unlevered and levered DCF valuation models tailored for Genco Shipping & Trading Limited (GNK).
- WACC Calculator: Pre-designed Weighted Average Cost of Capital sheet with adjustable inputs specific to the shipping industry.
- Customizable Forecast Assumptions: Adjust growth rates, capital expenditures, and discount rates to reflect Genco's strategic outlook.
- Integrated Financial Ratios: Assess profitability, leverage, and efficiency ratios relevant to Genco Shipping & Trading Limited (GNK).
- Visual Dashboard and Charts: Graphical representations summarize essential valuation metrics for straightforward analysis.
How It Works
- Download the Template: Gain immediate access to the Excel-based GNK DCF Calculator.
- Input Your Assumptions: Modify the yellow-highlighted cells for growth rates, WACC, margins, and other key metrics.
- Instant Calculations: The model automatically recalculates Genco Shipping & Trading Limited’s intrinsic value.
- Test Scenarios: Experiment with various assumptions to assess potential changes in valuation.
- Analyze and Decide: Leverage the results to inform your investment or financial analysis.
Why Choose This Calculator for Genco Shipping & Trading Limited (GNK)?
- All-in-One Solution: Combines DCF, WACC, and financial ratio analyses tailored for the shipping industry.
- Flexible Inputs: Modify yellow-highlighted fields to explore different financial scenarios.
- In-Depth Analysis: Automatically computes Genco’s intrinsic value and Net Present Value.
- Preloaded Information: Access to historical and projected data for precise evaluations.
- High-Quality Standards: Perfect for financial analysts, investors, and maritime business consultants.
Who Should Use This Product?
- Shipping and Trade Students: Understand maritime economics and apply your knowledge using real-world data.
- Researchers: Integrate industry-specific models into your academic studies or publications.
- Investors: Evaluate your investment strategies and analyze valuation scenarios for Genco Shipping & Trading Limited (GNK).
- Market Analysts: Enhance your analysis with a ready-made, customizable DCF model tailored for the shipping industry.
- Entrepreneurs: Discover how major shipping firms like Genco Shipping & Trading Limited (GNK) are assessed in the market.
What the Genco Shipping & Trading Limited (GNK) Template Contains
- Preloaded GNK Data: Historical and projected financial data, including revenue, EBIT, and capital expenditures.
- DCF and WACC Models: Professional-grade sheets for calculating intrinsic value and Weighted Average Cost of Capital.
- Editable Inputs: Yellow-highlighted cells for adjusting revenue growth, tax rates, and discount rates.
- Financial Statements: Comprehensive annual and quarterly financials for deeper analysis.
- Key Ratios: Profitability, leverage, and efficiency ratios to evaluate performance.
- Dashboard and Charts: Visual summaries of valuation outcomes and assumptions.
Disclaimer
All information, articles, and product details provided on this website are for general informational and educational purposes only. We do not claim any ownership over, nor do we intend to infringe upon, any trademarks, copyrights, logos, brand names, or other intellectual property mentioned or depicted on this site. Such intellectual property remains the property of its respective owners, and any references here are made solely for identification or informational purposes, without implying any affiliation, endorsement, or partnership.
We make no representations or warranties, express or implied, regarding the accuracy, completeness, or suitability of any content or products presented. Nothing on this website should be construed as legal, tax, investment, financial, medical, or other professional advice. In addition, no part of this site—including articles or product references—constitutes a solicitation, recommendation, endorsement, advertisement, or offer to buy or sell any securities, franchises, or other financial instruments, particularly in jurisdictions where such activity would be unlawful.
All content is of a general nature and may not address the specific circumstances of any individual or entity. It is not a substitute for professional advice or services. Any actions you take based on the information provided here are strictly at your own risk. You accept full responsibility for any decisions or outcomes arising from your use of this website and agree to release us from any liability in connection with your use of, or reliance upon, the content or products found herein.