
|
Gentex Corporation (GNTX) DCF تقييم |
Fully Editable: Tailor To Your Needs In Excel Or Sheets
Professional Design: Trusted, Industry-Standard Templates
Investor-Approved Valuation Models
MAC/PC Compatible, Fully Unlocked
No Expertise Is Needed; Easy To Follow
Gentex Corporation (GNTX) Bundle
قم بتقييم التوقعات المالية لشركة Gentex Corporation (GNTX) كخبير! توفر حاسبة DCF (GNTX) هذه بيانات مالية مملوءة مسبقًا وتوفر مرونة كاملة لتعديل نمو الإيرادات و WACC والهوامش والافتراضات الأساسية الأخرى لتتماشى مع توقعاتك.
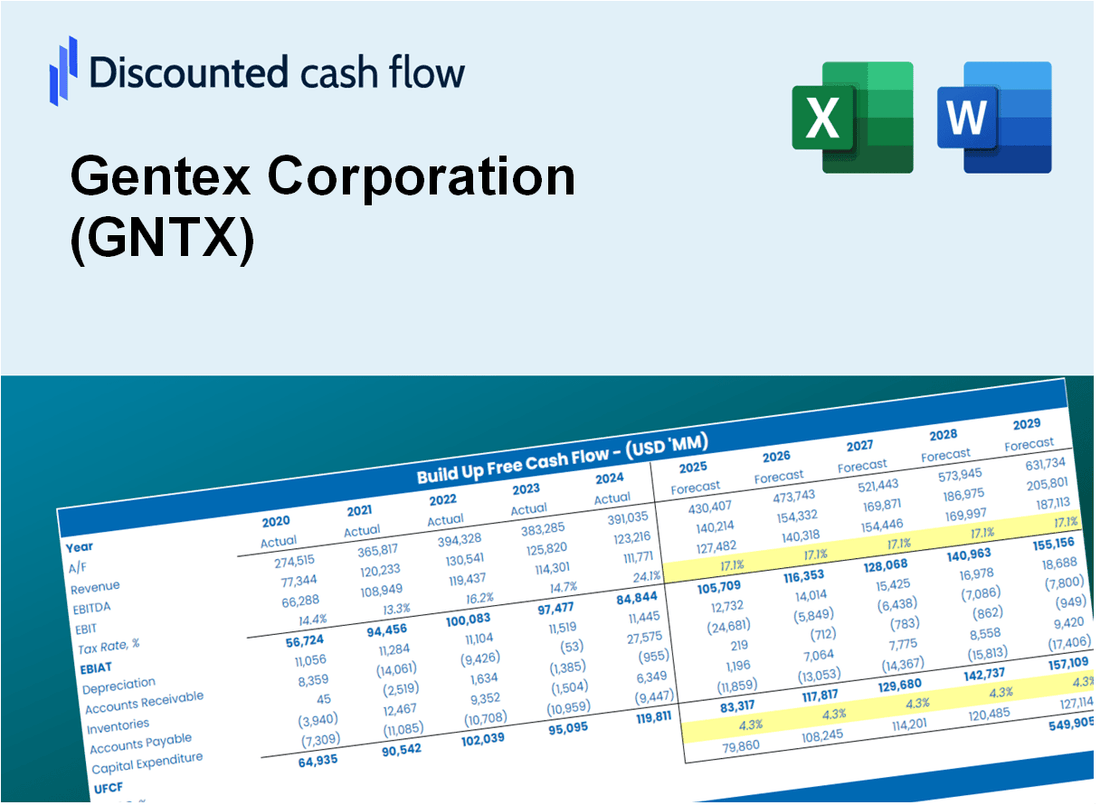
Discounted Cash Flow (DCF) - (USD MM)
| Year | AY1 2020 |
AY2 2021 |
AY3 2022 |
AY4 2023 |
AY5 2024 |
FY1 2025 |
FY2 2026 |
FY3 2027 |
FY4 2028 |
FY5 2029 |
|---|---|---|---|---|---|---|---|---|---|---|
| Revenue | 1,688.2 | 1,731.2 | 1,919.0 | 2,299.2 | 2,313.3 | 2,508.9 | 2,721.1 | 2,951.1 | 3,200.7 | 3,471.3 |
| Revenue Growth, % | 0 | 2.55 | 10.85 | 19.82 | 0.61322 | 8.46 | 8.46 | 8.46 | 8.46 | 8.46 |
| EBITDA | 504.3 | 508.9 | 466.6 | 589.1 | 563.3 | 670.1 | 726.8 | 788.3 | 854.9 | 927.2 |
| EBITDA, % | 29.87 | 29.4 | 24.31 | 25.62 | 24.35 | 26.71 | 26.71 | 26.71 | 26.71 | 26.71 |
| Depreciation | 104.7 | 99.1 | 96.6 | 93.3 | 94.7 | 126.0 | 136.7 | 148.2 | 160.8 | 174.4 |
| Depreciation, % | 6.2 | 5.73 | 5.03 | 4.06 | 4.09 | 5.02 | 5.02 | 5.02 | 5.02 | 5.02 |
| EBIT | 399.6 | 409.8 | 370.0 | 495.7 | 468.6 | 544.1 | 590.1 | 640.0 | 694.1 | 752.8 |
| EBIT, % | 23.67 | 23.67 | 19.28 | 21.56 | 20.26 | 21.69 | 21.69 | 21.69 | 21.69 | 21.69 |
| Total Cash | 450.5 | 267.7 | 241.8 | 240.8 | 255.6 | 382.7 | 415.1 | 450.2 | 488.3 | 529.5 |
| Total Cash, percent | .0 | .0 | .0 | .0 | .0 | .0 | .0 | .0 | .0 | .0 |
| Account Receivables | 284.9 | 249.8 | 276.5 | 321.8 | 295.3 | 363.7 | 394.4 | 427.8 | 464.0 | 503.2 |
| Account Receivables, % | 16.88 | 14.43 | 14.41 | 14 | 12.77 | 14.5 | 14.5 | 14.5 | 14.5 | 14.5 |
| Inventories | 226.3 | 316.3 | 404.4 | 402.5 | 436.5 | 447.2 | 485.0 | 526.0 | 570.5 | 618.7 |
| Inventories, % | 13.4 | 18.27 | 21.07 | 17.5 | 18.87 | 17.82 | 17.82 | 17.82 | 17.82 | 17.82 |
| Accounts Payable | 84.8 | 98.3 | 151.7 | 184.4 | 168.3 | 170.1 | 184.5 | 200.1 | 217.0 | 235.4 |
| Accounts Payable, % | 5.02 | 5.68 | 7.91 | 8.02 | 7.28 | 6.78 | 6.78 | 6.78 | 6.78 | 6.78 |
| Capital Expenditure | -51.7 | -68.8 | -146.4 | -183.7 | -144.7 | -145.1 | -157.3 | -170.6 | -185.1 | -200.7 |
| Capital Expenditure, % | -3.06 | -3.98 | -7.63 | -7.99 | -6.25 | -5.78 | -5.78 | -5.78 | -5.78 | -5.78 |
| Tax Rate, % | 14.34 | 14.34 | 14.34 | 14.34 | 14.34 | 14.34 | 14.34 | 14.34 | 14.34 | 14.34 |
| EBITAT | 337.2 | 355.1 | 319.0 | 420.6 | 401.4 | 465.5 | 504.9 | 547.6 | 593.9 | 644.1 |
| Depreciation | ||||||||||
| Changes in Account Receivables | ||||||||||
| Changes in Inventories | ||||||||||
| Changes in Accounts Payable | ||||||||||
| Capital Expenditure | ||||||||||
| UFCF | -36.2 | 344.1 | 207.7 | 319.4 | 327.8 | 369.2 | 430.0 | 466.4 | 505.8 | 548.6 |
| WACC, % | 7.43 | 7.43 | 7.43 | 7.43 | 7.43 | 7.43 | 7.43 | 7.43 | 7.43 | 7.43 |
| PV UFCF | ||||||||||
| SUM PV UFCF | 1,855.8 | |||||||||
| Long Term Growth Rate, % | 3.00 | |||||||||
| Free cash flow (T + 1) | 565 | |||||||||
| Terminal Value | 12,766 | |||||||||
| Present Terminal Value | 8,923 | |||||||||
| Enterprise Value | 10,778 | |||||||||
| Net Debt | -233 | |||||||||
| Equity Value | 11,012 | |||||||||
| Diluted Shares Outstanding, MM | 226 | |||||||||
| Equity Value Per Share | 48.72 |
What You Will Get
- Real GNTX Financial Data: Pre-filled with Gentex Corporation’s historical and projected data for precise analysis.
- Fully Editable Template: Modify key inputs like revenue growth, WACC, and EBITDA % with ease.
- Automatic Calculations: See Gentex Corporation’s intrinsic value update instantly based on your changes.
- Professional Valuation Tool: Designed for investors, analysts, and consultants seeking accurate DCF results.
- User-Friendly Design: Simple structure and clear instructions for all experience levels.
Key Features
- Pre-Loaded Data: Gentex Corporation’s historical financial statements and pre-filled forecasts.
- Fully Adjustable Inputs: Modify WACC, tax rates, revenue growth, and EBITDA margins as needed.
- Instant Results: Observe Gentex Corporation’s intrinsic value recalculating in real time.
- Clear Visual Outputs: Dashboard charts illustrate valuation results and essential metrics.
- Built for Accuracy: A professional tool designed for analysts, investors, and finance professionals.
How It Works
- Step 1: Download the Excel file for Gentex Corporation (GNTX).
- Step 2: Review Gentex's pre-filled financial data and projections.
- Step 3: Adjust key inputs such as revenue growth, WACC, and tax rates (highlighted cells).
- Step 4: Observe the DCF model update in real-time as you modify your assumptions.
- Step 5: Evaluate the outputs and leverage the results for your investment strategies.
Why Choose This Calculator for Gentex Corporation (GNTX)?
- Designed for Experts: A sophisticated tool utilized by financial analysts, CFOs, and industry consultants.
- Comprehensive Data: Gentex's historical and forecasted financial information preloaded for precise analysis.
- Flexible Scenario Analysis: Effortlessly simulate various forecasts and assumptions.
- Detailed Outputs: Automatically computes intrinsic value, NPV, and essential financial metrics.
- User-Friendly: Step-by-step guidance simplifies the calculation process.
Who Should Use This Product?
- Professional Investors: Develop comprehensive and accurate valuation models for assessing Gentex Corporation (GNTX) investments.
- Corporate Finance Teams: Evaluate valuation scenarios to inform strategic decisions for Gentex Corporation (GNTX).
- Consultants and Advisors: Offer clients precise valuation insights related to Gentex Corporation (GNTX) stock.
- Students and Educators: Utilize real-time data to enhance learning and practice in financial modeling focused on Gentex Corporation (GNTX).
- Tech Enthusiasts: Gain insights into how companies like Gentex Corporation (GNTX) are valued within the technology sector.
What the Template Contains
- Preloaded GNTX Data: Historical and projected financial data, including revenue, EBIT, and capital expenditures.
- DCF and WACC Models: Professional-grade sheets for calculating intrinsic value and Weighted Average Cost of Capital.
- Editable Inputs: Yellow-highlighted cells for adjusting revenue growth, tax rates, and discount rates.
- Financial Statements: Comprehensive annual and quarterly financials for deeper analysis.
- Key Ratios: Profitability, leverage, and efficiency ratios to evaluate performance.
- Dashboard and Charts: Visual summaries of valuation outcomes and assumptions.
Disclaimer
All information, articles, and product details provided on this website are for general informational and educational purposes only. We do not claim any ownership over, nor do we intend to infringe upon, any trademarks, copyrights, logos, brand names, or other intellectual property mentioned or depicted on this site. Such intellectual property remains the property of its respective owners, and any references here are made solely for identification or informational purposes, without implying any affiliation, endorsement, or partnership.
We make no representations or warranties, express or implied, regarding the accuracy, completeness, or suitability of any content or products presented. Nothing on this website should be construed as legal, tax, investment, financial, medical, or other professional advice. In addition, no part of this site—including articles or product references—constitutes a solicitation, recommendation, endorsement, advertisement, or offer to buy or sell any securities, franchises, or other financial instruments, particularly in jurisdictions where such activity would be unlawful.
All content is of a general nature and may not address the specific circumstances of any individual or entity. It is not a substitute for professional advice or services. Any actions you take based on the information provided here are strictly at your own risk. You accept full responsibility for any decisions or outcomes arising from your use of this website and agree to release us from any liability in connection with your use of, or reliance upon, the content or products found herein.