
|
Golden Ocean Group Limited (GOGL) DCF تقييم |
Fully Editable: Tailor To Your Needs In Excel Or Sheets
Professional Design: Trusted, Industry-Standard Templates
Investor-Approved Valuation Models
MAC/PC Compatible, Fully Unlocked
No Expertise Is Needed; Easy To Follow
Golden Ocean Group Limited (GOGL) Bundle
تبسيط تقييم Golden Ocean Group Limited (GOGL) مع هذه الآلة الحاسبة DCF القابلة للتخصيص! يضم مجموعات مالية Golden Ocean Group Limited (GOGL) ومدخلات التنبؤ القابلة للتعديل ، يمكنك اختبار السيناريوهات وكشف القيمة العادلة Golden Ocean Group Limited (GOGL) في دقائق.
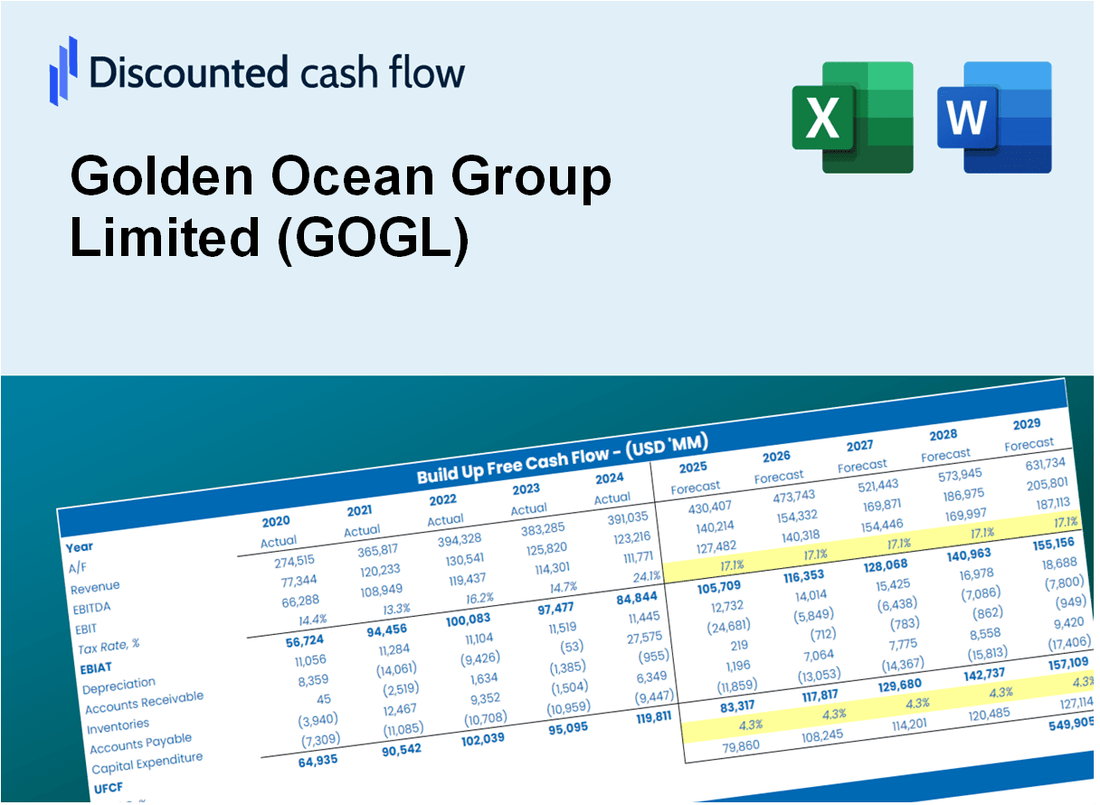
Discounted Cash Flow (DCF) - (USD MM)
| Year | AY1 2020 |
AY2 2021 |
AY3 2022 |
AY4 2023 |
AY5 2024 |
FY1 2025 |
FY2 2026 |
FY3 2027 |
FY4 2028 |
FY5 2029 |
|---|---|---|---|---|---|---|---|---|---|---|
| Revenue | 607.9 | 1,203.2 | 1,113.5 | 885.8 | 968.4 | 1,160.5 | 1,390.7 | 1,666.5 | 1,997.0 | 2,393.1 |
| Revenue Growth, % | 0 | 97.91 | -7.46 | -20.45 | 9.33 | 19.83 | 19.83 | 19.83 | 19.83 | 19.83 |
| EBITDA | 21.2 | 691.2 | 530.7 | 352.0 | 432.8 | 448.1 | 536.9 | 643.4 | 771.0 | 924.0 |
| EBITDA, % | 3.49 | 57.45 | 47.67 | 39.74 | 44.7 | 38.61 | 38.61 | 38.61 | 38.61 | 38.61 |
| Depreciation | 111.3 | 123.7 | 129.8 | 135.5 | 139.9 | 162.5 | 194.7 | 233.3 | 279.6 | 335.0 |
| Depreciation, % | 18.31 | 10.28 | 11.66 | 15.3 | 14.45 | 14 | 14 | 14 | 14 | 14 |
| EBIT | -90.1 | 567.5 | 400.9 | 216.5 | 292.9 | 285.6 | 342.2 | 410.1 | 491.4 | 588.9 |
| EBIT, % | -14.81 | 47.17 | 36.01 | 24.44 | 30.25 | 24.61 | 24.61 | 24.61 | 24.61 | 24.61 |
| Total Cash | 153.1 | 197.0 | 134.8 | 116.4 | 129.1 | 186.0 | 222.9 | 267.1 | 320.1 | 383.5 |
| Total Cash, percent | .0 | .0 | .0 | .0 | .0 | .0 | .0 | .0 | .0 | .0 |
| Account Receivables | 35.8 | 43.3 | 29.6 | 110.6 | 101.4 | 81.5 | 97.6 | 117.0 | 140.2 | 168.0 |
| Account Receivables, % | 5.89 | 3.6 | 2.66 | 12.49 | 10.47 | 7.02 | 7.02 | 7.02 | 7.02 | 7.02 |
| Inventories | 25.2 | 43.4 | 45.4 | 40.9 | 37.5 | 47.1 | 56.5 | 67.7 | 81.1 | 97.2 |
| Inventories, % | 4.14 | 3.61 | 4.08 | 4.62 | 3.87 | 4.06 | 4.06 | 4.06 | 4.06 | 4.06 |
| Accounts Payable | 18.4 | 6.5 | 7.1 | 9.5 | 11.8 | 15.1 | 18.1 | 21.7 | 26.0 | 31.1 |
| Accounts Payable, % | 3.03 | 0.53708 | 0.64152 | 1.08 | 1.22 | 1.3 | 1.3 | 1.3 | 1.3 | 1.3 |
| Capital Expenditure | -25.3 | -445.0 | -61.0 | -477.5 | -101.5 | -257.7 | -308.8 | -370.0 | -443.4 | -531.3 |
| Capital Expenditure, % | -4.16 | -36.99 | -5.48 | -53.91 | -10.48 | -22.2 | -22.2 | -22.2 | -22.2 | -22.2 |
| Tax Rate, % | 0.2449 | 0.2449 | 0.2449 | 0.2449 | 0.2449 | 0.2449 | 0.2449 | 0.2449 | 0.2449 | 0.2449 |
| EBITAT | -90.1 | 567.1 | 400.6 | 215.4 | 292.2 | 285.1 | 341.6 | 409.4 | 490.6 | 587.9 |
| Depreciation | ||||||||||
| Changes in Account Receivables | ||||||||||
| Changes in Inventories | ||||||||||
| Changes in Accounts Payable | ||||||||||
| Capital Expenditure | ||||||||||
| UFCF | -46.7 | 208.1 | 481.7 | -200.6 | 345.6 | 203.4 | 205.0 | 245.7 | 294.4 | 352.8 |
| WACC, % | 8.36 | 8.35 | 8.35 | 8.34 | 8.35 | 8.35 | 8.35 | 8.35 | 8.35 | 8.35 |
| PV UFCF | ||||||||||
| SUM PV UFCF | 1,005.5 | |||||||||
| Long Term Growth Rate, % | 0.50 | |||||||||
| Free cash flow (T + 1) | 355 | |||||||||
| Terminal Value | 4,517 | |||||||||
| Present Terminal Value | 3,025 | |||||||||
| Enterprise Value | 4,030 | |||||||||
| Net Debt | 1,251 | |||||||||
| Equity Value | 2,780 | |||||||||
| Diluted Shares Outstanding, MM | 200 | |||||||||
| Equity Value Per Share | 13.90 |
What You Will Get
- Editable Excel Template: A fully customizable Excel-based DCF Calculator featuring pre-filled real GOGL financials.
- Real-World Data: Historical data and forward-looking estimates (highlighted in the yellow cells).
- Forecast Flexibility: Adjust forecast assumptions such as revenue growth, EBITDA %, and WACC.
- Automatic Calculations: Instantly view the effects of your inputs on Golden Ocean Group’s valuation.
- Professional Tool: Designed for investors, CFOs, consultants, and financial analysts.
- User-Friendly Design: Organized for clarity and ease of use, complete with step-by-step instructions.
Key Features
- 🔍 Real-Life GOGL Financials: Pre-filled historical and projected data for Golden Ocean Group Limited (GOGL).
- ✏️ Fully Customizable Inputs: Adjust all critical parameters (yellow cells) such as WACC, growth %, and tax rates.
- 📊 Professional DCF Valuation: Built-in formulas calculate Golden Ocean's intrinsic value using the Discounted Cash Flow method.
- ⚡ Instant Results: Visualize Golden Ocean's valuation instantly after making changes.
- Scenario Analysis: Test and compare outcomes for various financial assumptions side-by-side.
How It Works
- 1. Access the Model: Download and open the Excel template featuring Golden Ocean Group Limited’s (GOGL) financial data.
- 2. Adjust Key Inputs: Modify essential parameters such as growth projections, WACC, and capital expenditures.
- 3. Analyze Results in Real-Time: The DCF model automatically computes intrinsic value and NPV based on your inputs.
- 4. Explore Different Scenarios: Evaluate various forecasts to understand the impact on valuation outcomes.
- 5. Present with Assurance: Deliver professional valuation analysis to enhance your decision-making process.
Why Choose This Calculator for Golden Ocean Group Limited (GOGL)?
- All-in-One Solution: Combines DCF, WACC, and financial ratio analyses tailored for GOGL.
- Flexible Inputs: Modify the highlighted cells to explore different investment scenarios.
- In-Depth Analysis: Automatically computes Golden Ocean's intrinsic value and Net Present Value.
- Preloaded Information: Access historical and projected data for reliable analysis.
- Expert-Level Tool: Perfect for financial analysts, investors, and maritime industry consultants.
Who Should Use This Product?
- Investors: Accurately estimate Golden Ocean Group Limited’s (GOGL) fair value before making investment decisions.
- CFOs: Utilize a professional-grade DCF model for financial reporting and analysis specific to Golden Ocean Group Limited (GOGL).
- Consultants: Quickly customize the template for valuation reports tailored to clients interested in Golden Ocean Group Limited (GOGL).
- Entrepreneurs: Gain insights into financial modeling practices employed by leading companies like Golden Ocean Group Limited (GOGL).
- Educators: Use it as a teaching resource to illustrate valuation methodologies relevant to Golden Ocean Group Limited (GOGL).
What the Template Contains
- Operating and Balance Sheet Data: Pre-filled Golden Ocean Group Limited (GOGL) historical data and forecasts, including revenue, EBITDA, EBIT, and capital expenditures.
- WACC Calculation: A dedicated sheet for Weighted Average Cost of Capital (WACC), including parameters like Beta, risk-free rate, and share price.
- DCF Valuation (Unlevered and Levered): Editable Discounted Cash Flow models showing intrinsic value with detailed calculations.
- Financial Statements: Pre-loaded financial statements (annual and quarterly) to support analysis.
- Key Ratios: Includes profitability, leverage, and efficiency ratios for Golden Ocean Group Limited (GOGL).
- Dashboard and Charts: Visual summary of valuation outputs and assumptions to analyze results easily.
Disclaimer
All information, articles, and product details provided on this website are for general informational and educational purposes only. We do not claim any ownership over, nor do we intend to infringe upon, any trademarks, copyrights, logos, brand names, or other intellectual property mentioned or depicted on this site. Such intellectual property remains the property of its respective owners, and any references here are made solely for identification or informational purposes, without implying any affiliation, endorsement, or partnership.
We make no representations or warranties, express or implied, regarding the accuracy, completeness, or suitability of any content or products presented. Nothing on this website should be construed as legal, tax, investment, financial, medical, or other professional advice. In addition, no part of this site—including articles or product references—constitutes a solicitation, recommendation, endorsement, advertisement, or offer to buy or sell any securities, franchises, or other financial instruments, particularly in jurisdictions where such activity would be unlawful.
All content is of a general nature and may not address the specific circumstances of any individual or entity. It is not a substitute for professional advice or services. Any actions you take based on the information provided here are strictly at your own risk. You accept full responsibility for any decisions or outcomes arising from your use of this website and agree to release us from any liability in connection with your use of, or reliance upon, the content or products found herein.