
|
Grasim Industries Limited (grasim.ns) تقييم DCF |
Fully Editable: Tailor To Your Needs In Excel Or Sheets
Professional Design: Trusted, Industry-Standard Templates
Investor-Approved Valuation Models
MAC/PC Compatible, Fully Unlocked
No Expertise Is Needed; Easy To Follow
Grasim Industries Limited (GRASIM.NS) Bundle
اكتساب نظرة ثاقبة على تحليل تقييم Grasim Industries Limited (Grasimns) باستخدام حاسبة DCF المتطورة! يأتي قالب Excel هذا مسبقًا مع بيانات حقيقية (Grasimns) ، مما يتيح لك ضبط التوقعات والافتراضات لتحديد القيمة الجوهرية لـ Grasim Industries Limited بدقة.
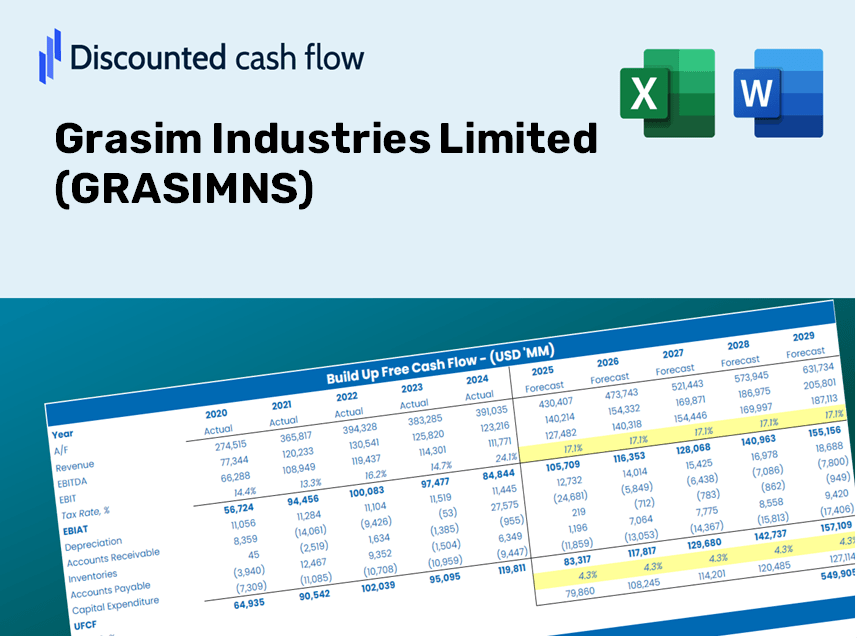
Discounted Cash Flow (DCF) - (USD MM)
| Year | AY1 2021 |
AY2 2022 |
AY3 2023 |
AY4 2024 |
AY5 2025 |
FY1 2026 |
FY2 2027 |
FY3 2028 |
FY4 2029 |
FY5 2030 |
|---|---|---|---|---|---|---|---|---|---|---|
| Revenue | 764,042.9 | 957,011.3 | 1,176,270.8 | 1,309,784.8 | 1,484,778.9 | 1,755,299.0 | 2,075,106.7 | 2,453,181.9 | 2,900,140.8 | 3,428,533.6 |
| Revenue Growth, % | 0 | 25.26 | 22.91 | 11.35 | 13.36 | 18.22 | 18.22 | 18.22 | 18.22 | 18.22 |
| EBITDA | 184,196.5 | 201,909.9 | 211,569.9 | 267,087.2 | 276,425.3 | 358,788.6 | 424,158.3 | 501,438.0 | 592,797.8 | 700,802.9 |
| EBITDA, % | 24.11 | 21.1 | 17.99 | 20.39 | 18.62 | 20.44 | 20.44 | 20.44 | 20.44 | 20.44 |
| Depreciation | 37,433.8 | 37,540.5 | 40,969.5 | 45,070.3 | 58,101.0 | 69,015.8 | 81,590.2 | 96,455.5 | 114,029.3 | 134,804.9 |
| Depreciation, % | 4.9 | 3.92 | 3.48 | 3.44 | 3.91 | 3.93 | 3.93 | 3.93 | 3.93 | 3.93 |
| EBIT | 146,762.7 | 164,369.4 | 170,600.4 | 222,016.9 | 218,324.3 | 289,772.8 | 342,568.1 | 404,982.5 | 478,768.5 | 565,998.0 |
| EBIT, % | 19.21 | 17.18 | 14.5 | 16.95 | 14.7 | 16.51 | 16.51 | 16.51 | 16.51 | 16.51 |
| Total Cash | 276,204.7 | 221,340.1 | 224,443.7 | 270,056.9 | 250,453.1 | 406,689.1 | 480,786.0 | 568,383.1 | 671,940.0 | 794,364.5 |
| Total Cash, percent | .0 | .0 | .0 | .0 | .0 | .0 | .0 | .0 | .0 | .0 |
| Account Receivables | 43,417.8 | 54,293.6 | 59,151.0 | 70,544.2 | 91,586.3 | 98,082.1 | 115,952.2 | 137,078.2 | 162,053.2 | 191,578.6 |
| Account Receivables, % | 5.68 | 5.67 | 5.03 | 5.39 | 6.17 | 5.59 | 5.59 | 5.59 | 5.59 | 5.59 |
| Inventories | 61,969.6 | 95,364.2 | 111,591.5 | 135,447.8 | 156,144.2 | 169,983.1 | 200,953.3 | 237,566.1 | 280,849.5 | 332,019.1 |
| Inventories, % | 8.11 | 9.96 | 9.49 | 10.34 | 10.52 | 9.68 | 9.68 | 9.68 | 9.68 | 9.68 |
| Accounts Payable | 79,168.4 | 113,934.4 | 133,532.7 | 153,570.6 | 154,381.0 | 195,686.6 | 231,339.8 | 273,488.9 | 323,317.3 | 382,224.3 |
| Accounts Payable, % | 10.36 | 11.91 | 11.35 | 11.72 | 10.4 | 11.15 | 11.15 | 11.15 | 11.15 | 11.15 |
| Capital Expenditure | -36,485.6 | -85,876.8 | -120,361.6 | -194,850.3 | -171,813.4 | -177,037.4 | -209,292.8 | -247,425.0 | -292,504.8 | -345,797.8 |
| Capital Expenditure, % | -4.78 | -8.97 | -10.23 | -14.88 | -11.57 | -10.09 | -10.09 | -10.09 | -10.09 | -10.09 |
| Tax Rate, % | 65.77 | 65.77 | 65.77 | 65.77 | 65.77 | 65.77 | 65.77 | 65.77 | 65.77 | 65.77 |
| EBITAT | 64,656.6 | 98,278.8 | 79,089.9 | 91,149.6 | 74,737.7 | 130,684.0 | 154,494.1 | 182,642.2 | 215,918.8 | 255,258.3 |
| Depreciation | ||||||||||
| Changes in Account Receivables | ||||||||||
| Changes in Inventories | ||||||||||
| Changes in Accounts Payable | ||||||||||
| Capital Expenditure | ||||||||||
| UFCF | 39,385.8 | 40,438.1 | -1,788.6 | -73,842.0 | -79,902.8 | 43,633.3 | 13,604.4 | 16,083.0 | 19,013.3 | 22,477.4 |
| WACC, % | 3.82 | 4.35 | 3.9 | 3.72 | 3.49 | 3.86 | 3.86 | 3.86 | 3.86 | 3.86 |
| PV UFCF | ||||||||||
| SUM PV UFCF | 103,931.9 | |||||||||
| Long Term Growth Rate, % | 2.00 | |||||||||
| Free cash flow (T + 1) | 22,927 | |||||||||
| Terminal Value | 1,235,842 | |||||||||
| Present Terminal Value | 1,022,874 | |||||||||
| Enterprise Value | 1,126,806 | |||||||||
| Net Debt | 1,784,201 | |||||||||
| Equity Value | -657,395 | |||||||||
| Diluted Shares Outstanding, MM | 668 | |||||||||
| Equity Value Per Share | -984.57 |
فوائد اختيار Grasim Industries Limited (Grasimns)
- نموذج مالي شامل: الاستفادة من البيانات المالية الفعلية لـ Grasim لتقييم DCF دقيق.
- تخصيص التوقعات الكاملة: تعديل نمو الإيرادات ، هوامش الربح ، WACC ، وغيرها من المتغيرات الحرجة.
- الحسابات في الوقت الحقيقي: استمتع بالتحديثات التلقائية التي تعرض نتائجها على الفور أثناء ضبط المعلمات.
- قالب من الدرجة المهنية: ملف Excel المصقول مصنوعًا لمخرجات تقييم عالية الجودة.
- مرنة وقابلة لإعادة الاستخدام: تم تصميمه للتكيف ، مما يتيح الاستخدام المستمر للتنبؤات المالية المتعمقة.
الميزات الرئيسية
- 🔍 البيانات المالية في الحياة الواقعية: البيانات التاريخية والمتوقعة مسبقًا لـ Grasim Industries Limited (Grasimns).
- ✏️ مدخلات قابلة للتخصيص بالكامل: تعديل جميع المعلمات الأساسية (الخلايا الصفراء) مثل WACC و Growth ٪ ومعدلات الضرائب.
- 📊 تقييم DCF المهني: تقوم الصيغ المتكاملة بتقييم القيمة الجوهرية لـ Grasim باستخدام طريقة التدفق النقدي المخفض.
- ⚡ النتائج الفورية: انظر تقييم Grasim مباشرة بعد إجراء التعديلات.
- تحليل السيناريو: استكشاف ومقارنة نتائج الافتراضات المالية المختلفة جنبًا إلى جنب.
كيف يعمل
- الخطوة 1: قم بتنزيل قالب Excel المصمم مسبقًا والذي يتضمن بيانات لشركة Grasim Industries Limited (GRASIMNS).
- الخطوة 2: تنقل من خلال الصفائح المملوءة مسبقًا لفهم المقاييس الأساسية.
- الخطوة 3: تعديل التوقعات والافتراضات في الخلايا الصفراء القابلة للتحرير (WACC ومعدلات النمو والهوامش).
- الخطوة 4: شاهد على الفور النتائج المعاد معايرتها، والتي تشمل القيمة الجوهرية لشركة Grasim Industries Limited (GRASIMNS).
- الخطوة 5: استخدام النواتج المتولدة لاتخاذ خيارات استثمارية مستنيرة أو إعداد تقارير مفصلة.
لماذا تختار حاسبة Grasim Industries؟
- دقة: يستخدم بيانات Grasim المالية الفعلية لنتائج موثوقة.
- التنوع: يمكن للمستخدمين ضبط وتجربة مدخلات مختلفة بسهولة.
- كفاءة: التخلص من الحاجة إلى إنشاء نموذج DCF من الألف إلى الياء.
- جودة عالية: تم إنشاؤها مع توقعات دقة وسهولة الاستخدام من كبار المديرين التنفيذيين.
- حدسي: سهل التنقل ، مناسب للمستخدمين الذين لديهم مستويات مختلفة من الخبرة المالية.
من يمكنه الاستفادة من هذا المنتج؟
- طلاب التمويل: أساليب التقييم الرئيسية وتطبيقها مع بيانات العالم الحقيقي.
- الأكاديميون: دمج النماذج المهنية في المناهج الدراسية أو مشاريع البحث.
- المستثمرون: التحقق من صحة افتراضاتك وتقييم سيناريوهات التقييم لـ Grasim Industries Limited (Grasimns).
- المحللون: عزز كفاءتك من خلال نموذج DCF جاهز للاستخدام وقابل للتخصيص.
- أصحاب الأعمال الصغيرة: فهم النهج التحليلية المستخدمة للشركات العامة الكبيرة مثل Grasim Industries Limited (Grasimns).
محتويات القالب
- نموذج DCF الشامل: قالب قابل للتحرير يضم حسابات التقييم المتعمقة.
- بيانات العالم الحقيقي: تم تحميل البيانات المالية التاريخية والمتوقعة من Grasim Industries Limited للتحليل.
- المعلمات القابلة للتخصيص: تعديل WACC ومعدلات النمو والافتراضات الضريبية لاستكشاف السيناريوهات المختلفة.
- البيانات المالية: الانهيار السنوي والفصلي الكامل لتصوير رؤى محسنة.
- النسب الرئيسية: تحليل متكامل للربحية والكفاءة والرافعة المالية.
- لوحة القيادة مع المخرجات المرئية: الرسوم البيانية والجداول توفر نتائج واضحة وقابلة للتنفيذ.
Disclaimer
All information, articles, and product details provided on this website are for general informational and educational purposes only. We do not claim any ownership over, nor do we intend to infringe upon, any trademarks, copyrights, logos, brand names, or other intellectual property mentioned or depicted on this site. Such intellectual property remains the property of its respective owners, and any references here are made solely for identification or informational purposes, without implying any affiliation, endorsement, or partnership.
We make no representations or warranties, express or implied, regarding the accuracy, completeness, or suitability of any content or products presented. Nothing on this website should be construed as legal, tax, investment, financial, medical, or other professional advice. In addition, no part of this site—including articles or product references—constitutes a solicitation, recommendation, endorsement, advertisement, or offer to buy or sell any securities, franchises, or other financial instruments, particularly in jurisdictions where such activity would be unlawful.
All content is of a general nature and may not address the specific circumstances of any individual or entity. It is not a substitute for professional advice or services. Any actions you take based on the information provided here are strictly at your own risk. You accept full responsibility for any decisions or outcomes arising from your use of this website and agree to release us from any liability in connection with your use of, or reliance upon, the content or products found herein.