
|
Galera Therapeutics ، Inc. (GRTX) DCF تقييم |
Fully Editable: Tailor To Your Needs In Excel Or Sheets
Professional Design: Trusted, Industry-Standard Templates
Investor-Approved Valuation Models
MAC/PC Compatible, Fully Unlocked
No Expertise Is Needed; Easy To Follow
Galera Therapeutics, Inc. (GRTX) Bundle
تبسيط تقييم Galera Therapeutics ، Inc. (GRTX) مع هذه الآلة الحاسبة DCF القابلة للتخصيص! يضم Real Galera Therapeutics ، Inc. (GRTX) ومدخلات التنبؤ القابلة للتعديل ، يمكنك اختبار السيناريوهات وكشف القيمة العادلة Galera Therapeutics ، Inc. (GRTX) في دقائق.
What You Will Receive
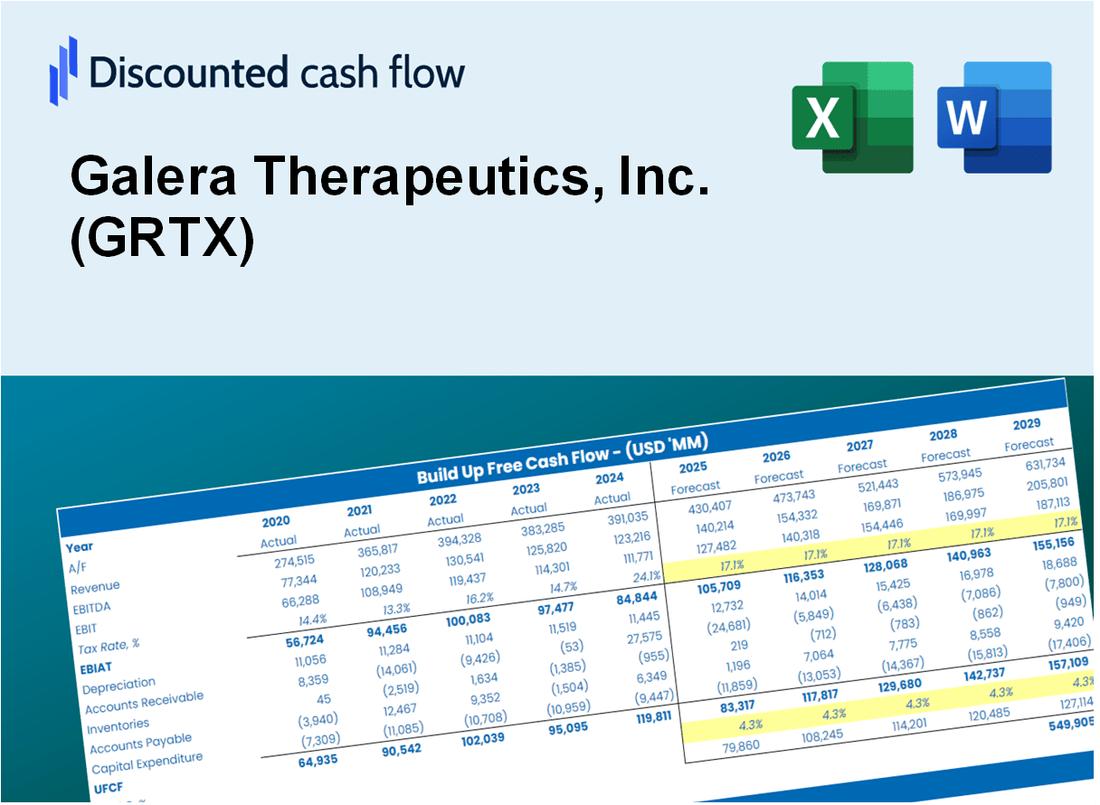
- Customizable Excel Template: A fully adjustable Excel-based DCF Calculator featuring pre-filled real GRTX financials.
- Actual Data Insights: Historical performance data and forward-looking projections (highlighted in the yellow cells).
- Assumption Flexibility: Modify forecast parameters such as revenue growth, EBITDA %, and WACC.
- Instant Calculations: Quickly observe how your inputs affect Galera Therapeutics' valuation.
- Professional Resource: Designed for investors, CFOs, consultants, and financial analysts.
- Intuitive Layout: Organized for clarity and simplicity, complete with step-by-step guidance.
Key Features
- Customizable Clinical Parameters: Adjust vital inputs such as trial success rates, market penetration, and R&D expenditures.
- Instant DCF Valuation: Quickly computes intrinsic value, NPV, and other financial metrics.
- High-Precision Accuracy: Incorporates Galera Therapeutics' actual financial data for dependable valuation results.
- Simplified Scenario Analysis: Easily evaluate various assumptions and analyze results side-by-side.
- Efficiency Booster: Avoid the hassle of constructing intricate valuation models from the ground up.
How It Works
- 1. Access the Template: Download and open the Excel file containing Galera Therapeutics, Inc. (GRTX) preloaded data.
- 2. Modify Assumptions: Adjust key variables such as growth rates, WACC, and capital expenditures.
- 3. Review Results Instantly: The DCF model automatically calculates intrinsic value and NPV.
- 4. Explore Scenarios: Analyze multiple forecasts to evaluate different valuation results.
- 5. Present with Confidence: Deliver professional valuation insights to bolster your decision-making process.
Why Choose Galera Therapeutics, Inc. (GRTX) Calculator?
- Comprehensive Tool: Integrates DCF, WACC, and financial ratio analyses tailored for Galera Therapeutics.
- Customizable Inputs: Modify yellow-highlighted cells to explore different investment scenarios.
- Detailed Insights: Automatically computes Galera’s intrinsic value and Net Present Value for informed decision-making.
- Preloaded Data: Includes historical and projected data for precise analysis and starting points.
- Professional Quality: Perfect for financial analysts, investors, and healthcare business consultants focusing on biotech.
Who Should Use Galera Therapeutics, Inc. (GRTX)?
- Investors: Gain insights into innovative therapies and make informed investment choices.
- Healthcare Analysts: Streamline your research with comprehensive data on clinical developments.
- Consultants: Tailor presentations or reports with up-to-date information on Galera's pipeline.
- Biotech Enthusiasts: Enhance your knowledge of cutting-edge treatments and their market potential.
- Educators and Students: Utilize it as a resource for studies in biotechnology and pharmaceutical sciences.
What the Template Contains
- Comprehensive DCF Model: Editable template featuring detailed valuation calculations tailored for Galera Therapeutics, Inc. (GRTX).
- Real-World Data: Galera Therapeutics’ historical and projected financials preloaded for in-depth analysis.
- Customizable Parameters: Modify WACC, growth rates, and tax assumptions to explore various scenarios.
- Financial Statements: Complete annual and quarterly breakdowns for enhanced insights into the company’s performance.
- Key Ratios: Integrated analysis for profitability, efficiency, and leverage specific to Galera Therapeutics, Inc. (GRTX).
- Dashboard with Visual Outputs: Charts and tables designed for clear, actionable results related to Galera Therapeutics, Inc. (GRTX).
Disclaimer
All information, articles, and product details provided on this website are for general informational and educational purposes only. We do not claim any ownership over, nor do we intend to infringe upon, any trademarks, copyrights, logos, brand names, or other intellectual property mentioned or depicted on this site. Such intellectual property remains the property of its respective owners, and any references here are made solely for identification or informational purposes, without implying any affiliation, endorsement, or partnership.
We make no representations or warranties, express or implied, regarding the accuracy, completeness, or suitability of any content or products presented. Nothing on this website should be construed as legal, tax, investment, financial, medical, or other professional advice. In addition, no part of this site—including articles or product references—constitutes a solicitation, recommendation, endorsement, advertisement, or offer to buy or sell any securities, franchises, or other financial instruments, particularly in jurisdictions where such activity would be unlawful.
All content is of a general nature and may not address the specific circumstances of any individual or entity. It is not a substitute for professional advice or services. Any actions you take based on the information provided here are strictly at your own risk. You accept full responsibility for any decisions or outcomes arising from your use of this website and agree to release us from any liability in connection with your use of, or reliance upon, the content or products found herein.