
|
Hudbay Minerals Inc. (HBM) DCF تقييم |
Fully Editable: Tailor To Your Needs In Excel Or Sheets
Professional Design: Trusted, Industry-Standard Templates
Investor-Approved Valuation Models
MAC/PC Compatible, Fully Unlocked
No Expertise Is Needed; Easy To Follow
Hudbay Minerals Inc. (HBM) Bundle
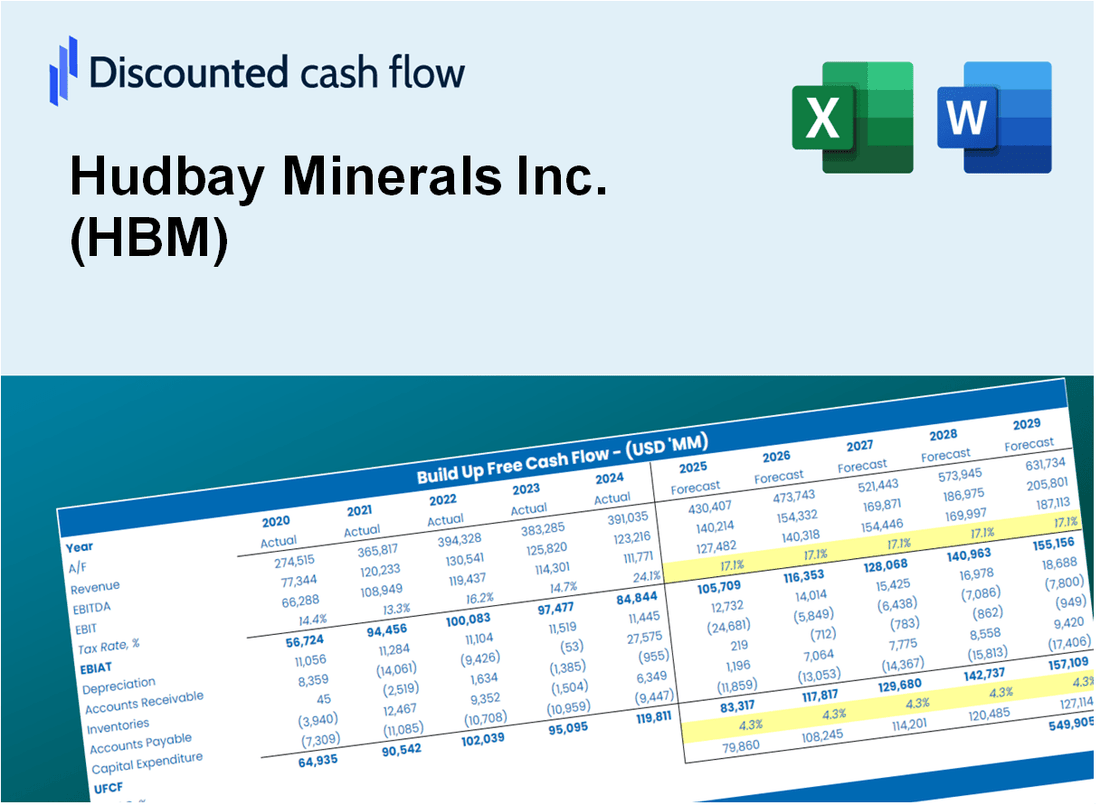
تم تصميم حاسبة DCF الخاصة بنا ، المصممة من أجل الدقة ، من تقييم تقييم Hudbay Minerals باستخدام البيانات المالية الفعلية ، مع تقديم مرونة كاملة لتعديل جميع المعلمات الأساسية للتوقعات المحسنة.
Discounted Cash Flow (DCF) - (USD MM)
| Year | AY1 2020 |
AY2 2021 |
AY3 2022 |
AY4 2023 |
AY5 2024 |
FY1 2025 |
FY2 2026 |
FY3 2027 |
FY4 2028 |
FY5 2029 |
|---|---|---|---|---|---|---|---|---|---|---|
| Revenue | 1,092.4 | 1,502.0 | 1,461.4 | 1,690.0 | 2,021.2 | 2,375.1 | 2,790.9 | 3,279.5 | 3,853.6 | 4,528.3 |
| Revenue Growth, % | 0 | 37.49 | -2.7 | 15.64 | 19.6 | 17.51 | 17.51 | 17.51 | 17.51 | 17.51 |
| EBITDA | 294.4 | 242.4 | 498.4 | 653.1 | 856.3 | 751.4 | 883.0 | 1,037.6 | 1,219.3 | 1,432.7 |
| EBITDA, % | 26.95 | 16.14 | 34.1 | 38.64 | 42.37 | 31.64 | 31.64 | 31.64 | 31.64 | 31.64 |
| Depreciation | 363.6 | 361.5 | 333.8 | 410.4 | 437.9 | 599.2 | 704.1 | 827.4 | 972.2 | 1,142.4 |
| Depreciation, % | 33.28 | 24.07 | 22.84 | 24.28 | 21.67 | 25.23 | 25.23 | 25.23 | 25.23 | 25.23 |
| EBIT | -69.2 | -119.1 | 164.6 | 242.7 | 418.4 | 152.2 | 178.9 | 210.2 | 247.0 | 290.3 |
| EBIT, % | -6.34 | -7.93 | 11.26 | 14.36 | 20.7 | 6.41 | 6.41 | 6.41 | 6.41 | 6.41 |
| Total Cash | 439.1 | 271.0 | 225.7 | 250.5 | 581.8 | 557.1 | 654.7 | 769.3 | 904.0 | 1,062.2 |
| Total Cash, percent | .0 | .0 | .0 | .0 | .0 | .0 | .0 | .0 | .0 | .0 |
| Account Receivables | 153.6 | 204.1 | 122.3 | 169.8 | 236.6 | 274.4 | 322.5 | 378.9 | 445.3 | 523.2 |
| Account Receivables, % | 14.06 | 13.59 | 8.37 | 10.05 | 11.71 | 11.55 | 11.55 | 11.55 | 11.55 | 11.55 |
| Inventories | 143.1 | 158.5 | 155.0 | 207.3 | 197.4 | 267.4 | 314.2 | 369.2 | 433.8 | 509.8 |
| Inventories, % | 13.1 | 10.55 | 10.61 | 12.27 | 9.77 | 11.26 | 11.26 | 11.26 | 11.26 | 11.26 |
| Accounts Payable | 104.6 | 84.3 | 83.8 | 68.9 | 66.7 | 134.4 | 158.0 | 185.6 | 218.1 | 256.3 |
| Accounts Payable, % | 9.57 | 5.61 | 5.74 | 4.08 | 3.3 | 5.66 | 5.66 | 5.66 | 5.66 | 5.66 |
| Capital Expenditure | -361.2 | -377.4 | -309.0 | -286.3 | -347.1 | -538.9 | -633.2 | -744.1 | -874.3 | -1,027.4 |
| Capital Expenditure, % | -33.06 | -25.13 | -21.14 | -16.94 | -17.17 | -22.69 | -22.69 | -22.69 | -22.69 | -22.69 |
| Tax Rate, % | 69.52 | 69.52 | 69.52 | 69.52 | 69.52 | 69.52 | 69.52 | 69.52 | 69.52 | 69.52 |
| EBITAT | -55.9 | -143.6 | 120.9 | 106.1 | 127.5 | 100.0 | 117.5 | 138.1 | 162.3 | 190.7 |
| Depreciation | ||||||||||
| Changes in Account Receivables | ||||||||||
| Changes in Inventories | ||||||||||
| Changes in Accounts Payable | ||||||||||
| Capital Expenditure | ||||||||||
| UFCF | -245.6 | -245.6 | 230.5 | 115.5 | 159.3 | 120.2 | 117.1 | 137.6 | 161.7 | 190.0 |
| WACC, % | 12.52 | 12.73 | 12.44 | 12.12 | 11.97 | 12.36 | 12.36 | 12.36 | 12.36 | 12.36 |
| PV UFCF | ||||||||||
| SUM PV UFCF | 504.3 | |||||||||
| Long Term Growth Rate, % | 2.00 | |||||||||
| Free cash flow (T + 1) | 194 | |||||||||
| Terminal Value | 1,871 | |||||||||
| Present Terminal Value | 1,045 | |||||||||
| Enterprise Value | 1,549 | |||||||||
| Net Debt | 641 | |||||||||
| Equity Value | 908 | |||||||||
| Diluted Shares Outstanding, MM | 377 | |||||||||
| Equity Value Per Share | 2.41 |
What You Will Get
- Real Hudbay Data: Preloaded financials – from revenue to EBIT – based on actual and projected figures.
- Full Customization: Adjust all critical parameters (yellow cells) like WACC, growth %, and tax rates.
- Instant Valuation Updates: Automatic recalculations to analyze the impact of changes on Hudbay's fair value.
- Versatile Excel Template: Tailored for quick edits, scenario testing, and detailed projections.
- Time-Saving and Accurate: Skip building models from scratch while maintaining precision and flexibility.
Key Features
- Customizable Mining Metrics: Adjust essential parameters such as production volume, cost per ton, and mineral reserves.
- Instant DCF Valuation: Quickly computes intrinsic value, NPV, and other financial metrics.
- Industry-Leading Precision: Utilizes Hudbay Minerals Inc.'s (HBM) actual financial data for accurate valuation results.
- Effortless Scenario Analysis: Evaluate various market conditions and analyze outcomes with ease.
- Efficiency Booster: Remove the hassle of constructing intricate valuation models from the ground up.
How It Works
- Step 1: Download the Excel file.
- Step 2: Review pre-entered Hudbay Minerals Inc. (HBM) data (historical and projected).
- Step 3: Adjust key assumptions (yellow cells) based on your analysis.
- Step 4: View automatic recalculations for Hudbay Minerals Inc.'s intrinsic value.
- Step 5: Use the outputs for investment decisions or reporting.
Why Choose This Calculator for Hudbay Minerals Inc. (HBM)?
- Accuracy: Utilizes real Hudbay financials to ensure precise data.
- Flexibility: Tailored for users to easily test and adjust inputs as needed.
- Time-Saving: Eliminate the complexity of constructing a DCF model from the ground up.
- Professional-Grade: Crafted with the precision and usability expected at the CFO level.
- User-Friendly: Intuitive design makes it accessible for individuals without extensive financial modeling skills.
Who Should Use Hudbay Minerals Inc. (HBM)?
- Investors: Gain insights into mining investments with a reliable valuation tool tailored for Hudbay Minerals Inc. (HBM).
- Financial Analysts: Streamline your analysis with a customizable DCF model specific to the mining sector.
- Consultants: Effortlessly modify the template for impactful client presentations or detailed reports on Hudbay Minerals Inc. (HBM).
- Mining Enthusiasts: Enhance your knowledge of mining operations and valuation methods through practical examples.
- Educators and Students: Utilize it as an effective resource for learning about finance and mining in academic settings.
What the Template Contains
- Historical Data: Includes Hudbay Minerals Inc.'s (HBM) past financials and baseline forecasts.
- DCF and Levered DCF Models: Detailed templates to calculate Hudbay Minerals Inc.'s (HBM) intrinsic value.
- WACC Sheet: Pre-built calculations for Weighted Average Cost of Capital.
- Editable Inputs: Modify key drivers like growth rates, EBITDA %, and CAPEX assumptions.
- Quarterly and Annual Statements: A complete breakdown of Hudbay Minerals Inc.'s (HBM) financials.
- Interactive Dashboard: Visualize valuation results and projections dynamically.
Disclaimer
All information, articles, and product details provided on this website are for general informational and educational purposes only. We do not claim any ownership over, nor do we intend to infringe upon, any trademarks, copyrights, logos, brand names, or other intellectual property mentioned or depicted on this site. Such intellectual property remains the property of its respective owners, and any references here are made solely for identification or informational purposes, without implying any affiliation, endorsement, or partnership.
We make no representations or warranties, express or implied, regarding the accuracy, completeness, or suitability of any content or products presented. Nothing on this website should be construed as legal, tax, investment, financial, medical, or other professional advice. In addition, no part of this site—including articles or product references—constitutes a solicitation, recommendation, endorsement, advertisement, or offer to buy or sell any securities, franchises, or other financial instruments, particularly in jurisdictions where such activity would be unlawful.
All content is of a general nature and may not address the specific circumstances of any individual or entity. It is not a substitute for professional advice or services. Any actions you take based on the information provided here are strictly at your own risk. You accept full responsibility for any decisions or outcomes arising from your use of this website and agree to release us from any liability in connection with your use of, or reliance upon, the content or products found herein.