
|
التقييم Global Inc. (HGBL) DCF |
Fully Editable: Tailor To Your Needs In Excel Or Sheets
Professional Design: Trusted, Industry-Standard Templates
Investor-Approved Valuation Models
MAC/PC Compatible, Fully Unlocked
No Expertise Is Needed; Easy To Follow
Heritage Global Inc. (HGBL) Bundle
تُمكّنك حاسبة DCF (HGBL) التي تم تصميمها من أجل الدقة (HGBL) لتقييم تقييم Heritage Global Inc. باستخدام البيانات المالية في العالم الحقيقي ، مع توفير مرونة كاملة لتعديل جميع المعلمات الأساسية للتوقعات المحسنة.
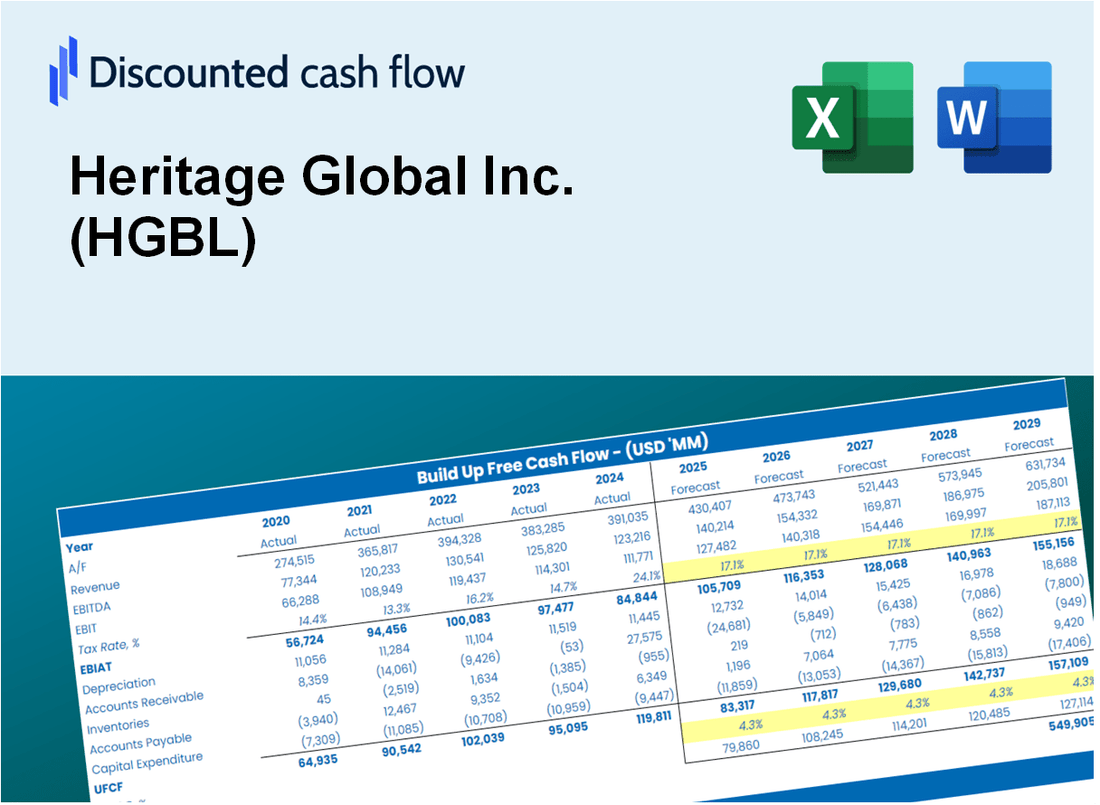
Discounted Cash Flow (DCF) - (USD MM)
| Year | AY1 2020 |
AY2 2021 |
AY3 2022 |
AY4 2023 |
AY5 2024 |
FY1 2025 |
FY2 2026 |
FY3 2027 |
FY4 2028 |
FY5 2029 |
|---|---|---|---|---|---|---|---|---|---|---|
| Revenue | 26.2 | 25.8 | 46.9 | 60.5 | 45.4 | 54.9 | 66.5 | 80.5 | 97.5 | 118.1 |
| Revenue Growth, % | 0 | -1.49 | 81.89 | 29.06 | -25.08 | 21.09 | 21.09 | 21.09 | 21.09 | 21.09 |
| EBITDA | 6.4 | 3.5 | 11.7 | 14.8 | 10.3 | 12.1 | 14.6 | 17.7 | 21.5 | 26.0 |
| EBITDA, % | 24.52 | 13.47 | 24.85 | 24.5 | 22.74 | 22.02 | 22.02 | 22.02 | 22.02 | 22.02 |
| Depreciation | .4 | .5 | .5 | .5 | 1.2 | .9 | 1.1 | 1.3 | 1.5 | 1.9 |
| Depreciation, % | 1.38 | 1.78 | 1.14 | 0.84896 | 2.75 | 1.58 | 1.58 | 1.58 | 1.58 | 1.58 |
| EBIT | 6.1 | 3.0 | 11.1 | 14.3 | 9.1 | 11.2 | 13.6 | 16.5 | 19.9 | 24.1 |
| EBIT, % | 23.14 | 11.69 | 23.7 | 23.65 | 19.99 | 20.43 | 20.43 | 20.43 | 20.43 | 20.43 |
| Total Cash | 23.4 | 13.6 | 12.7 | 12.3 | 21.7 | 26.1 | 31.6 | 38.2 | 46.3 | 56.1 |
| Total Cash, percent | .0 | .0 | .0 | .0 | .0 | .0 | .0 | .0 | .0 | .0 |
| Account Receivables | 2.8 | 2.7 | 1.0 | 1.9 | 5.0 | 4.1 | 5.0 | 6.1 | 7.3 | 8.9 |
| Account Receivables, % | 10.82 | 10.59 | 2.11 | 3.15 | 10.97 | 7.53 | 7.53 | 7.53 | 7.53 | 7.53 |
| Inventories | .2 | 3.2 | 4.6 | 5.1 | 5.3 | 4.8 | 5.8 | 7.0 | 8.5 | 10.3 |
| Inventories, % | 0.89753 | 12.48 | 9.85 | 8.38 | 11.79 | 8.68 | 8.68 | 8.68 | 8.68 | 8.68 |
| Accounts Payable | .0 | 6.5 | 3.2 | 5.0 | 7.4 | 6.2 | 7.5 | 9.1 | 11.0 | 13.3 |
| Accounts Payable, % | 0 | 25.01 | 6.8 | 8.22 | 16.35 | 11.28 | 11.28 | 11.28 | 11.28 | 11.28 |
| Capital Expenditure | .0 | -1.4 | -.2 | -.3 | -.1 | -.7 | -.9 | -1.1 | -1.3 | -1.6 |
| Capital Expenditure, % | -0.0267349 | -5.52 | -0.45829 | -0.42448 | -0.30202 | -1.35 | -1.35 | -1.35 | -1.35 | -1.35 |
| Tax Rate, % | 42.25 | 42.25 | 42.25 | 42.25 | 42.25 | 42.25 | 42.25 | 42.25 | 42.25 | 42.25 |
| EBITAT | 9.7 | 3.1 | 15.7 | 12.8 | 5.2 | 10.0 | 12.1 | 14.7 | 17.8 | 21.6 |
| Depreciation | ||||||||||
| Changes in Account Receivables | ||||||||||
| Changes in Inventories | ||||||||||
| Changes in Accounts Payable | ||||||||||
| Capital Expenditure | ||||||||||
| UFCF | 7.0 | 5.7 | 13.1 | 13.4 | 5.4 | 10.4 | 11.7 | 14.2 | 17.2 | 20.8 |
| WACC, % | 6.45 | 6.45 | 6.45 | 6.43 | 6.37 | 6.43 | 6.43 | 6.43 | 6.43 | 6.43 |
| PV UFCF | ||||||||||
| SUM PV UFCF | 60.5 | |||||||||
| Long Term Growth Rate, % | 2.00 | |||||||||
| Free cash flow (T + 1) | 21 | |||||||||
| Terminal Value | 480 | |||||||||
| Present Terminal Value | 351 | |||||||||
| Enterprise Value | 412 | |||||||||
| Net Debt | -19 | |||||||||
| Equity Value | 431 | |||||||||
| Diluted Shares Outstanding, MM | 37 | |||||||||
| Equity Value Per Share | 11.60 |
What You Will Receive
- Adjustable Forecast Inputs: Effortlessly modify key assumptions (growth %, margins, WACC) to explore various scenarios.
- Comprehensive Data: Heritage Global Inc.'s financial data pre-loaded to facilitate your analysis.
- Automated DCF Outputs: The template computes Net Present Value (NPV) and intrinsic value automatically.
- Tailored and Professional: A refined Excel model that meets your valuation requirements.
- Designed for Analysts and Investors: Perfect for testing projections, validating strategies, and enhancing efficiency.
Key Features
- Comprehensive DCF Calculator: Offers in-depth unlevered and levered DCF valuation models tailored for Heritage Global Inc. (HGBL).
- WACC Calculator: Comes with a pre-configured Weighted Average Cost of Capital sheet that allows for customizable inputs.
- Adjustable Forecast Assumptions: Easily modify growth rates, capital expenditures, and discount rates to suit your analysis.
- Integrated Financial Ratios: Evaluate profitability, leverage, and efficiency ratios specifically for Heritage Global Inc. (HGBL).
- Interactive Dashboard and Charts: Visual representations that summarize essential valuation metrics for straightforward analysis.
How It Works
- Step 1: Download the prebuilt Excel template featuring Heritage Global Inc. (HGBL) data.
- Step 2: Review the pre-filled sheets to familiarize yourself with the essential metrics.
- Step 3: Modify forecasts and assumptions in the editable yellow cells (WACC, growth, margins).
- Step 4: Instantly see the recalculated results, including the intrinsic value of Heritage Global Inc. (HGBL).
- Step 5: Utilize the outputs to make informed investment decisions or create reports.
Why Choose This Calculator for Heritage Global Inc. (HGBL)?
- Designed for Experts: A sophisticated tool tailored for analysts, CFOs, and financial consultants.
- Comprehensive Data: Heritage Global’s historical and projected financials are preloaded for precise analysis.
- Flexible Scenario Analysis: Effortlessly simulate various forecasts and assumptions.
- Insightful Results: Automatically computes intrinsic value, NPV, and essential financial metrics.
- User-Friendly: Step-by-step guidance ensures a smooth user experience.
Who Should Use Heritage Global Inc. (HGBL)?
- Finance Students: Explore asset liquidation strategies and apply them to real-world scenarios.
- Academics: Utilize industry-standard models in your research or teaching materials.
- Investors: Evaluate your investment strategies and assess the market potential of Heritage Global Inc. (HGBL).
- Analysts: Enhance your analysis with a comprehensive, customizable asset management framework.
- Small Business Owners: Understand how public companies like Heritage Global Inc. (HGBL) approach asset valuation and management.
What the Template Contains
- Pre-Filled DCF Model: Heritage Global Inc.’s (HGBL) financial data preloaded for immediate use.
- WACC Calculator: Detailed calculations for Weighted Average Cost of Capital specific to (HGBL).
- Financial Ratios: Evaluate Heritage Global Inc.’s (HGBL) profitability, leverage, and efficiency.
- Editable Inputs: Change assumptions such as growth, margins, and CAPEX to fit your scenarios for (HGBL).
- Financial Statements: Annual and quarterly reports to support detailed analysis of (HGBL).
- Interactive Dashboard: Easily visualize key valuation metrics and results for Heritage Global Inc. (HGBL).
Disclaimer
All information, articles, and product details provided on this website are for general informational and educational purposes only. We do not claim any ownership over, nor do we intend to infringe upon, any trademarks, copyrights, logos, brand names, or other intellectual property mentioned or depicted on this site. Such intellectual property remains the property of its respective owners, and any references here are made solely for identification or informational purposes, without implying any affiliation, endorsement, or partnership.
We make no representations or warranties, express or implied, regarding the accuracy, completeness, or suitability of any content or products presented. Nothing on this website should be construed as legal, tax, investment, financial, medical, or other professional advice. In addition, no part of this site—including articles or product references—constitutes a solicitation, recommendation, endorsement, advertisement, or offer to buy or sell any securities, franchises, or other financial instruments, particularly in jurisdictions where such activity would be unlawful.
All content is of a general nature and may not address the specific circumstances of any individual or entity. It is not a substitute for professional advice or services. Any actions you take based on the information provided here are strictly at your own risk. You accept full responsibility for any decisions or outcomes arising from your use of this website and agree to release us from any liability in connection with your use of, or reliance upon, the content or products found herein.