
|
High Tide Inc. (HITI) DCF تقييم |
Fully Editable: Tailor To Your Needs In Excel Or Sheets
Professional Design: Trusted, Industry-Standard Templates
Investor-Approved Valuation Models
MAC/PC Compatible, Fully Unlocked
No Expertise Is Needed; Easy To Follow
High Tide Inc. (HITI) Bundle
تُمكّنك حاسبة DCF الخاصة بنا (HITI) DCF لتقييم تقييم Tide Inc. العالي باستخدام البيانات المالية في العالم الحقيقي ، مما يوفر مرونة كاملة لتعديل جميع المعلمات الأساسية للتوقعات المحسنة.
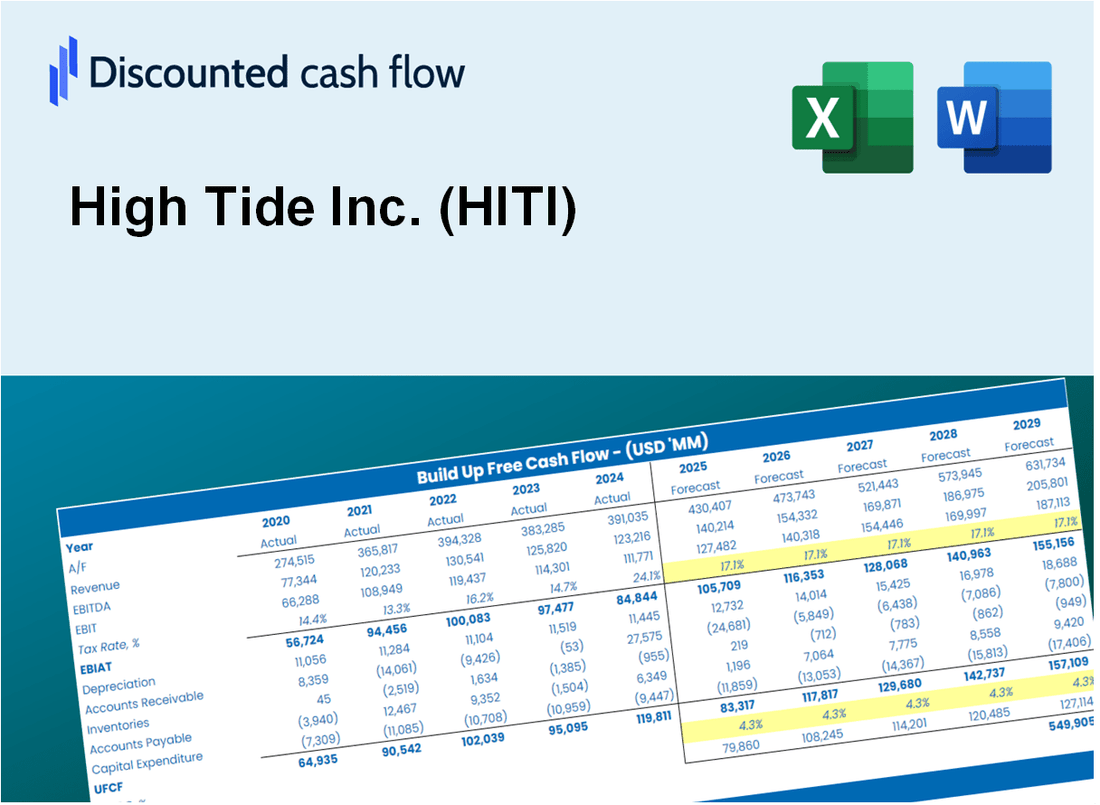
Discounted Cash Flow (DCF) - (USD MM)
| Year | AY1 2020 |
AY2 2021 |
AY3 2022 |
AY4 2023 |
AY5 2024 |
FY1 2025 |
FY2 2026 |
FY3 2027 |
FY4 2028 |
FY5 2029 |
|---|---|---|---|---|---|---|---|---|---|---|
| Revenue | 59.7 | 129.8 | 255.8 | 349.6 | 374.4 | 599.8 | 960.9 | 1,539.3 | 2,465.9 | 3,950.3 |
| Revenue Growth, % | 0 | 117.53 | 97.02 | 36.66 | 7.1 | 60.2 | 60.2 | 60.2 | 60.2 | 60.2 |
| EBITDA | 4.4 | 3.5 | -24.1 | -3.0 | 24.2 | 7.4 | 11.9 | 19.1 | 30.5 | 48.9 |
| EBITDA, % | 7.35 | 2.66 | -9.43 | -0.86124 | 6.47 | 1.24 | 1.24 | 1.24 | 1.24 | 1.24 |
| Depreciation | 4.9 | 16.9 | 21.6 | 23.5 | 18.2 | 49.4 | 79.2 | 126.9 | 203.2 | 325.6 |
| Depreciation, % | 8.16 | 13.01 | 8.45 | 6.72 | 4.86 | 8.24 | 8.24 | 8.24 | 8.24 | 8.24 |
| EBIT | -.5 | -13.4 | -45.7 | -26.5 | 6.0 | -42.0 | -67.3 | -107.8 | -172.7 | -276.7 |
| EBIT, % | -0.81307 | -10.35 | -17.88 | -7.58 | 1.61 | -7 | -7 | -7 | -7 | -7 |
| Total Cash | 5.4 | 10.7 | 18.1 | 21.7 | 34.4 | 47.7 | 76.5 | 122.5 | 196.2 | 314.3 |
| Total Cash, percent | .0 | .0 | .0 | .0 | .0 | .0 | .0 | .0 | .0 | .0 |
| Account Receivables | 1.9 | 4.7 | 5.7 | 5.4 | 2.4 | 13.4 | 21.5 | 34.5 | 55.2 | 88.5 |
| Account Receivables, % | 3.21 | 3.59 | 2.22 | 1.55 | 0.63335 | 2.24 | 2.24 | 2.24 | 2.24 | 2.24 |
| Inventories | 4.1 | 12.2 | 16.8 | 18.6 | 21.0 | 40.5 | 64.9 | 103.9 | 166.5 | 266.7 |
| Inventories, % | 6.85 | 9.41 | 6.56 | 5.33 | 5.62 | 6.75 | 6.75 | 6.75 | 6.75 | 6.75 |
| Accounts Payable | 4.6 | 6.3 | 5.5 | 6.0 | 5.8 | 21.5 | 34.5 | 55.2 | 88.5 | 141.7 |
| Accounts Payable, % | 7.71 | 4.82 | 2.15 | 1.71 | 1.54 | 3.59 | 3.59 | 3.59 | 3.59 | 3.59 |
| Capital Expenditure | -2.0 | -7.7 | -6.5 | -4.4 | -7.0 | -17.9 | -28.6 | -45.8 | -73.4 | -117.7 |
| Capital Expenditure, % | -3.33 | -5.91 | -2.54 | -1.25 | -1.87 | -2.98 | -2.98 | -2.98 | -2.98 | -2.98 |
| Tax Rate, % | 1.52 | 1.52 | 1.52 | 1.52 | 1.52 | 1.52 | 1.52 | 1.52 | 1.52 | 1.52 |
| EBITAT | -.5 | -13.2 | -43.9 | -21.4 | 5.9 | -39.8 | -63.7 | -102.1 | -163.5 | -261.9 |
| Depreciation | ||||||||||
| Changes in Account Receivables | ||||||||||
| Changes in Inventories | ||||||||||
| Changes in Accounts Payable | ||||||||||
| Capital Expenditure | ||||||||||
| UFCF | 1.0 | -13.2 | -35.2 | -3.4 | 17.6 | -23.0 | -32.6 | -52.3 | -83.8 | -134.2 |
| WACC, % | 9.61 | 9.55 | 9.5 | 9.06 | 9.57 | 9.46 | 9.46 | 9.46 | 9.46 | 9.46 |
| PV UFCF | ||||||||||
| SUM PV UFCF | -231.9 | |||||||||
| Long Term Growth Rate, % | 2.00 | |||||||||
| Free cash flow (T + 1) | -137 | |||||||||
| Terminal Value | -1,835 | |||||||||
| Present Terminal Value | -1,168 | |||||||||
| Enterprise Value | -1,400 | |||||||||
| Net Debt | 20 | |||||||||
| Equity Value | -1,419 | |||||||||
| Diluted Shares Outstanding, MM | 80 | |||||||||
| Equity Value Per Share | -17.84 |
What You Will Receive
- Comprehensive Financial Model: High Tide Inc.’s (HITI) actual data facilitates accurate DCF valuation.
- Complete Forecast Control: Modify revenue growth, profit margins, WACC, and other essential metrics.
- Real-Time Calculations: Automatic updates provide immediate insights as you adjust parameters.
- Professional-Grade Template: A polished Excel file crafted for high-quality valuation presentations.
- Flexible and Reusable: Designed for adaptability, enabling repeated application for in-depth forecasts.
Key Features
- 🔍 Real-Life HITI Financials: Pre-filled historical and projected data for High Tide Inc. (HITI).
- ✏️ Fully Customizable Inputs: Adjust all critical parameters (yellow cells) like WACC, growth %, and tax rates.
- 📊 Professional DCF Valuation: Built-in formulas calculate High Tide’s intrinsic value using the Discounted Cash Flow method.
- ⚡ Instant Results: Visualize High Tide’s valuation instantly after making changes.
- Scenario Analysis: Test and compare outcomes for various financial assumptions side-by-side.
How It Works
- Step 1: Download the Excel file.
- Step 2: Review High Tide Inc.'s pre-filled financial data and forecasts.
- Step 3: Modify critical inputs such as revenue growth, WACC, and tax rates (highlighted cells).
- Step 4: Watch the DCF model update instantly as you adjust your assumptions.
- Step 5: Analyze the outputs and utilize the results for your investment decisions.
Why Choose High Tide Inc. (HITI) Calculator?
- All-in-One Solution: Features DCF, WACC, and comprehensive financial ratio analyses.
- Flexible Inputs: Modify the highlighted cells to explore different financial scenarios.
- In-Depth Analysis: Automatically computes High Tide Inc.'s intrinsic value and Net Present Value.
- Data-Rich: Comes with historical and projected data for precise analysis.
- Expert-Level Tool: Perfect for financial analysts, investors, and business advisors.
Who Should Use High Tide Inc. (HITI)?
- Investors: Gain insights and make informed decisions with our comprehensive market analysis tools.
- Financial Analysts: Enhance efficiency with our ready-to-use financial models tailored for your needs.
- Consultants: Easily modify our templates for impactful client presentations and strategic reports.
- Cannabis Industry Enthusiasts: Explore in-depth resources to expand your knowledge of the cannabis market.
- Educators and Students: Utilize our materials as a valuable resource in cannabis-related courses.
What the Template Contains
- Pre-Filled DCF Model: High Tide Inc.’s (HITI) financial data preloaded for immediate use.
- WACC Calculator: Detailed calculations for Weighted Average Cost of Capital.
- Financial Ratios: Evaluate High Tide Inc.’s (HITI) profitability, leverage, and efficiency.
- Editable Inputs: Change assumptions such as growth, margins, and CAPEX to fit your scenarios.
- Financial Statements: Annual and quarterly reports to support detailed analysis.
- Interactive Dashboard: Easily visualize key valuation metrics and results.
Disclaimer
All information, articles, and product details provided on this website are for general informational and educational purposes only. We do not claim any ownership over, nor do we intend to infringe upon, any trademarks, copyrights, logos, brand names, or other intellectual property mentioned or depicted on this site. Such intellectual property remains the property of its respective owners, and any references here are made solely for identification or informational purposes, without implying any affiliation, endorsement, or partnership.
We make no representations or warranties, express or implied, regarding the accuracy, completeness, or suitability of any content or products presented. Nothing on this website should be construed as legal, tax, investment, financial, medical, or other professional advice. In addition, no part of this site—including articles or product references—constitutes a solicitation, recommendation, endorsement, advertisement, or offer to buy or sell any securities, franchises, or other financial instruments, particularly in jurisdictions where such activity would be unlawful.
All content is of a general nature and may not address the specific circumstances of any individual or entity. It is not a substitute for professional advice or services. Any actions you take based on the information provided here are strictly at your own risk. You accept full responsibility for any decisions or outcomes arising from your use of this website and agree to release us from any liability in connection with your use of, or reliance upon, the content or products found herein.