
|
Robinhood Markets ، Inc. (Hood) DCF تقييم |
Fully Editable: Tailor To Your Needs In Excel Or Sheets
Professional Design: Trusted, Industry-Standard Templates
Investor-Approved Valuation Models
MAC/PC Compatible, Fully Unlocked
No Expertise Is Needed; Easy To Follow
Robinhood Markets, Inc. (HOOD) Bundle
عزز خيارات الاستثمار الخاصة بك مع حاسبة DCF (Hood) DCF! استكشاف البيانات المالية الأصيلة ، وضبط تنبؤات النمو والنفقات ، ومراقبة على الفور كيف تؤثر هذه التغييرات على القيمة الجوهرية لأسواق Robinhood ، Inc. (Hood).
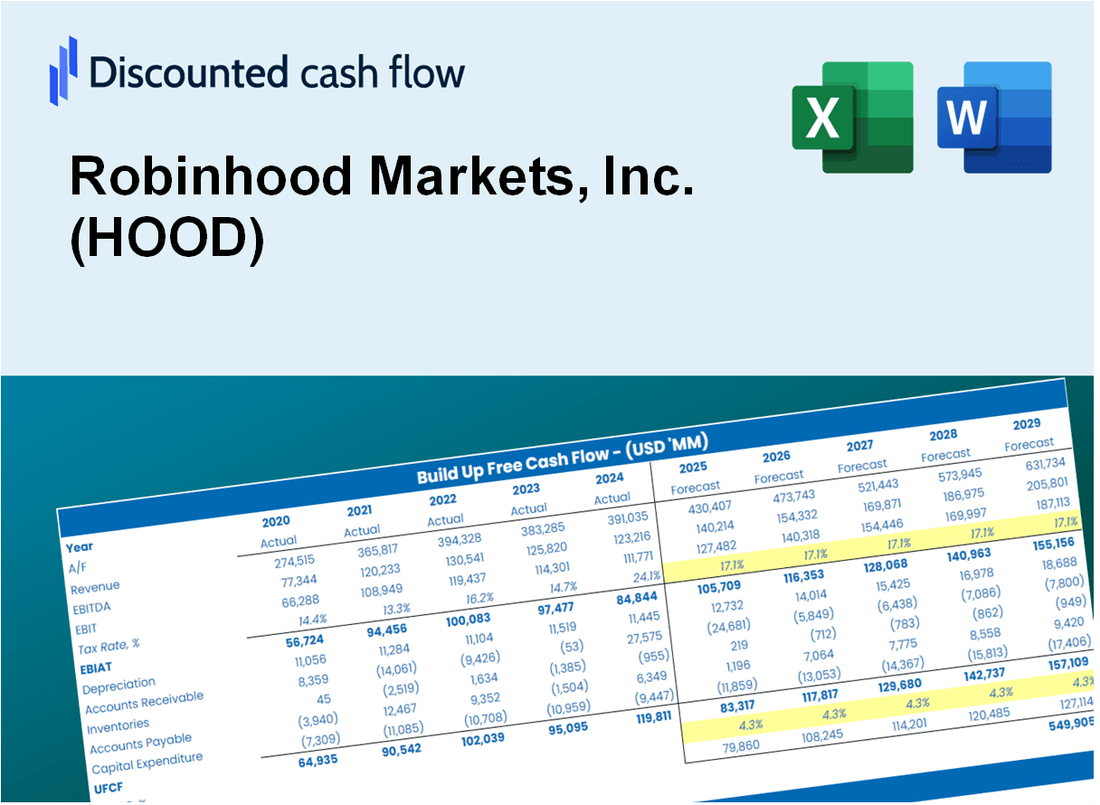
Discounted Cash Flow (DCF) - (USD MM)
| Year | AY1 2020 |
AY2 2021 |
AY3 2022 |
AY4 2023 |
AY5 2024 |
FY1 2025 |
FY2 2026 |
FY3 2027 |
FY4 2028 |
FY5 2029 |
|---|---|---|---|---|---|---|---|---|---|---|
| Revenue | 958.0 | 1,815.0 | 1,358.0 | 1,865.0 | 2,951.0 | 4,130.2 | 5,780.7 | 8,090.7 | 11,323.9 | 15,849.0 |
| Revenue Growth, % | 0 | 89.46 | -25.18 | 37.33 | 58.23 | 39.96 | 39.96 | 39.96 | 39.96 | 39.96 |
| EBITDA | 23.0 | -1,615.0 | -905.0 | -460.0 | 1,133.0 | -1,152.3 | -1,612.7 | -2,257.2 | -3,159.2 | -4,421.6 |
| EBITDA, % | 2.4 | -88.98 | -66.64 | -24.66 | 38.39 | -27.9 | -27.9 | -27.9 | -27.9 | -27.9 |
| Depreciation | 10.0 | 26.0 | 61.0 | 71.0 | 77.0 | 110.6 | 154.7 | 216.6 | 303.1 | 424.3 |
| Depreciation, % | 1.04 | 1.43 | 4.49 | 3.81 | 2.61 | 2.68 | 2.68 | 2.68 | 2.68 | 2.68 |
| EBIT | 13.0 | -1,641.0 | -966.0 | -531.0 | 1,056.0 | -1,262.8 | -1,767.5 | -2,473.8 | -3,462.3 | -4,845.9 |
| EBIT, % | 1.36 | -90.41 | -71.13 | -28.47 | 35.78 | -30.58 | -30.58 | -30.58 | -30.58 | -30.58 |
| Total Cash | 2,205.1 | 8,087.0 | 7,853.0 | 8,442.0 | 10,496.0 | 4,130.2 | 5,780.7 | 8,090.7 | 11,323.9 | 15,849.0 |
| Total Cash, percent | .0 | .0 | .0 | .0 | .0 | .0 | .0 | .0 | .0 | .0 |
| Account Receivables | 3,478.6 | 6,727.0 | 3,294.0 | 3,584.0 | 8,710.0 | 4,130.2 | 5,780.7 | 8,090.7 | 11,323.9 | 15,849.0 |
| Account Receivables, % | 363.12 | 370.63 | 242.56 | 192.17 | 295.15 | 100 | 100 | 100 | 100 | 100 |
| Inventories | .0 | .0 | .0 | .0 | .0 | .0 | .0 | .0 | .0 | .0 |
| Inventories, % | 0 | 0 | 0 | 0 | 0 | 0 | 0 | 0 | 0 | 0 |
| Accounts Payable | 104.6 | 252.0 | 185.0 | 384.0 | 397.0 | 598.7 | 837.9 | 1,172.7 | 1,641.4 | 2,297.3 |
| Accounts Payable, % | 10.92 | 13.88 | 13.62 | 20.59 | 13.45 | 14.49 | 14.49 | 14.49 | 14.49 | 14.49 |
| Capital Expenditure | -32.3 | -83.7 | -57.0 | -21.0 | -13.0 | -113.6 | -158.9 | -222.5 | -311.4 | -435.8 |
| Capital Expenditure, % | -3.37 | -4.61 | -4.2 | -1.13 | -0.44053 | -2.75 | -2.75 | -2.75 | -2.75 | -2.75 |
| Tax Rate, % | -32.61 | -32.61 | -32.61 | -32.61 | -32.61 | -32.61 | -32.61 | -32.61 | -32.61 | -32.61 |
| EBITAT | 7.0 | -1,641.9 | -966.9 | -539.0 | 1,400.4 | -1,146.3 | -1,604.3 | -2,245.4 | -3,142.7 | -4,398.6 |
| Depreciation | ||||||||||
| Changes in Account Receivables | ||||||||||
| Changes in Inventories | ||||||||||
| Changes in Accounts Payable | ||||||||||
| Capital Expenditure | ||||||||||
| UFCF | -3,389.3 | -4,800.5 | 2,403.1 | -580.0 | -3,648.6 | 3,632.2 | -3,019.8 | -4,226.5 | -5,915.4 | -8,279.3 |
| WACC, % | 14.35 | 14.46 | 14.46 | 14.46 | 14.46 | 14.43 | 14.43 | 14.43 | 14.43 | 14.43 |
| PV UFCF | ||||||||||
| SUM PV UFCF | -9,621.0 | |||||||||
| Long Term Growth Rate, % | 2.00 | |||||||||
| Free cash flow (T + 1) | -8,445 | |||||||||
| Terminal Value | -67,916 | |||||||||
| Present Terminal Value | -34,609 | |||||||||
| Enterprise Value | -44,230 | |||||||||
| Net Debt | 3,131 | |||||||||
| Equity Value | -47,361 | |||||||||
| Diluted Shares Outstanding, MM | 906 | |||||||||
| Equity Value Per Share | -52.26 |
What You Will Get
- Pre-Filled Financial Model: Robinhood's actual data provides an accurate DCF valuation.
- Full Forecast Control: Modify revenue growth, margins, WACC, and other essential drivers.
- Instant Calculations: Automatic updates allow you to see results in real-time as you make adjustments.
- Investor-Ready Template: A polished Excel file crafted for professional-level valuation.
- Customizable and Reusable: Designed for adaptability, enabling repeated use for in-depth forecasts.
Key Features
- Customizable Investment Parameters: Adjust essential metrics such as trading fees, asset allocation, and risk tolerance.
- Instant Portfolio Analysis: Provides real-time insights into your investments and potential returns.
- High-Precision Metrics: Utilizes Robinhood's market data for accurate investment evaluations.
- Effortless Strategy Testing: Experiment with various investment strategies and assess their performance effortlessly.
- Efficiency Booster: Streamline your investment planning without the hassle of complex calculations.
How It Works
- Step 1: Download the Excel file.
- Step 2: Review pre-entered Robinhood data (historical and projected).
- Step 3: Adjust key assumptions (yellow cells) based on your analysis.
- Step 4: View automatic recalculations for Robinhood’s intrinsic value.
- Step 5: Use the outputs for investment decisions or reporting.
Why Choose This Calculator?
- Designed for Investors: A sophisticated tool tailored for traders, analysts, and financial advisors.
- Up-to-Date Data: Robinhood’s historical and projected financials are included for precise analysis.
- Flexible Scenario Analysis: Effortlessly model various investment strategies and market conditions.
- Comprehensive Outputs: Instantly computes intrinsic value, NPV, and essential financial metrics.
- User-Friendly: Clear, step-by-step guidance simplifies the calculation process.
Who Should Use This Product?
- Investors: Accurately assess Robinhood's fair value before making investment choices.
- CFOs: Utilize a professional-grade DCF model for financial reporting and analysis tailored to Robinhood Markets, Inc. (HOOD).
- Consultants: Easily modify the template for valuation reports catered to clients interested in Robinhood.
- Entrepreneurs: Discover insights into financial modeling practices employed by leading tech firms like Robinhood.
- Educators: Implement it as a teaching resource to illustrate valuation techniques relevant to the fintech sector.
What the Template Contains
- Preloaded HOOD Data: Historical and projected financial data, including revenue, EBIT, and capital expenditures.
- DCF and WACC Models: Professional-grade sheets for calculating intrinsic value and Weighted Average Cost of Capital.
- Editable Inputs: Yellow-highlighted cells for adjusting revenue growth, tax rates, and discount rates.
- Financial Statements: Comprehensive annual and quarterly financials for deeper analysis.
- Key Ratios: Profitability, leverage, and efficiency ratios to evaluate performance.
- Dashboard and Charts: Visual summaries of valuation outcomes and assumptions.
Disclaimer
All information, articles, and product details provided on this website are for general informational and educational purposes only. We do not claim any ownership over, nor do we intend to infringe upon, any trademarks, copyrights, logos, brand names, or other intellectual property mentioned or depicted on this site. Such intellectual property remains the property of its respective owners, and any references here are made solely for identification or informational purposes, without implying any affiliation, endorsement, or partnership.
We make no representations or warranties, express or implied, regarding the accuracy, completeness, or suitability of any content or products presented. Nothing on this website should be construed as legal, tax, investment, financial, medical, or other professional advice. In addition, no part of this site—including articles or product references—constitutes a solicitation, recommendation, endorsement, advertisement, or offer to buy or sell any securities, franchises, or other financial instruments, particularly in jurisdictions where such activity would be unlawful.
All content is of a general nature and may not address the specific circumstances of any individual or entity. It is not a substitute for professional advice or services. Any actions you take based on the information provided here are strictly at your own risk. You accept full responsibility for any decisions or outcomes arising from your use of this website and agree to release us from any liability in connection with your use of, or reliance upon, the content or products found herein.