
|
في أي مكان العقارات (Hous) تقييم DCF |
Fully Editable: Tailor To Your Needs In Excel Or Sheets
Professional Design: Trusted, Industry-Standard Templates
Investor-Approved Valuation Models
MAC/PC Compatible, Fully Unlocked
No Expertise Is Needed; Easy To Follow
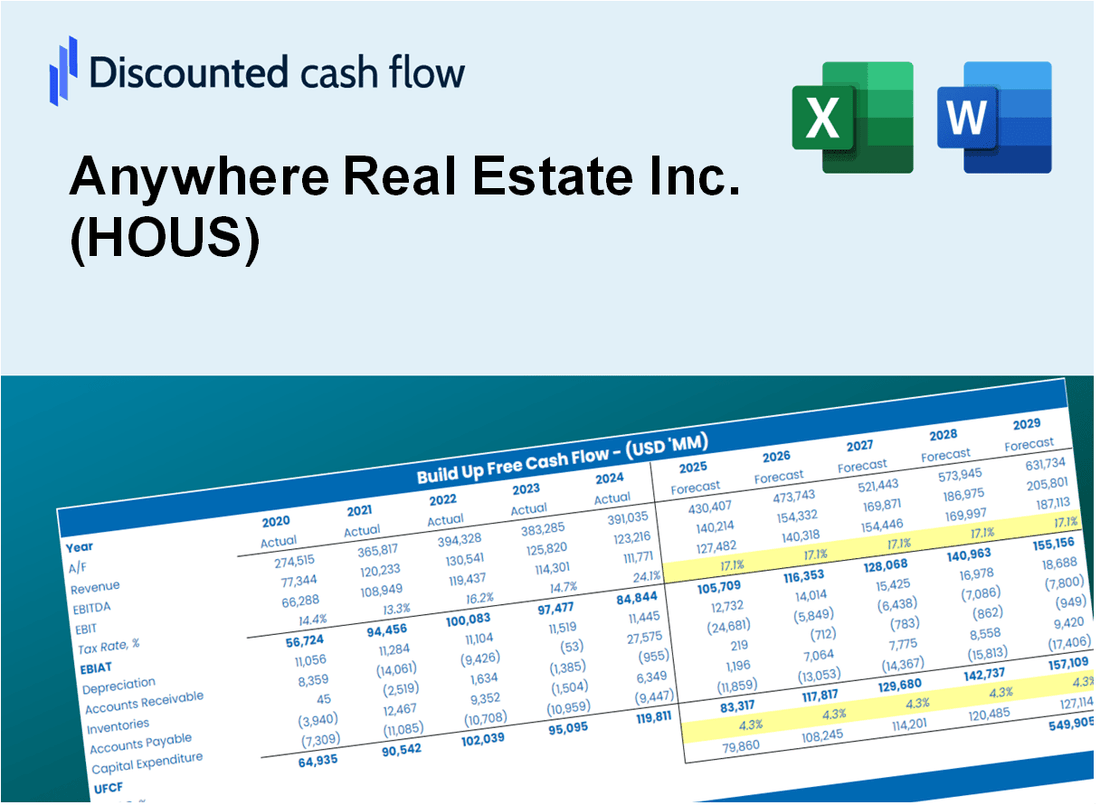
Anywhere Real Estate Inc. (HOUS) Bundle
استكشف الإمكانات المالية لشركة أي مكان Real Estate Inc. (Hous) مع حاسبة DCF سهلة الاستخدام! أدخل افتراضاتك للنمو والهوامش والتكاليف لحساب القيمة الجوهرية لشركة Real Estate Inc. (HOUS) وتعزيز استراتيجية الاستثمار الخاصة بك.
What You Will Get
- Comprehensive HOUS Financials: Access historical and projected data for precise valuation.
- Customizable Inputs: Adjust WACC, tax rates, revenue growth, and capital expenditures as needed.
- Real-Time Calculations: Intrinsic value and NPV are computed automatically.
- Scenario Analysis: Evaluate various scenarios to assess Anywhere Real Estate Inc.'s future performance.
- User-Friendly Interface: Designed for industry experts while remaining approachable for newcomers.
Key Features
- Customizable Market Inputs: Adjust essential factors such as property appreciation rates, commission structures, and operating costs.
- Instant Property Valuation: Provides immediate assessments of property worth, ROI, and other financial metrics.
- Industry-Leading Precision: Leverages real estate market data for accurate valuation projections.
- Effortless Scenario Planning: Experiment with various market conditions and evaluate potential outcomes with ease.
- Efficiency Booster: Remove the hassle of developing intricate valuation models from the ground up.
How It Works
- Step 1: Download the Excel file.
- Step 2: Review pre-entered Anywhere Real Estate Inc. (HOUS) data (historical and projected).
- Step 3: Adjust key assumptions (yellow cells) based on your analysis.
- Step 4: View automatic recalculations for Anywhere Real Estate Inc. (HOUS)’s intrinsic value.
- Step 5: Use the outputs for investment decisions or reporting.
Why Choose This Calculator for Anywhere Real Estate Inc. (HOUS)?
- Accuracy: Utilizes real Anywhere Real Estate financials for precise data.
- Flexibility: Tailored for users to easily adjust and test various inputs.
- Time-Saving: Eliminate the need to create a DCF model from the ground up.
- Professional-Grade: Crafted with the expertise and usability expected at the CFO level.
- User-Friendly: Intuitive interface suitable for users without extensive financial modeling skills.
Who Should Use This Product?
- Real Estate Investors: Develop comprehensive valuation models for property analysis.
- Corporate Finance Teams: Evaluate property valuation scenarios to inform strategic decisions.
- Consultants and Advisors: Deliver precise valuation insights for Anywhere Real Estate Inc. (HOUS) to clients.
- Students and Educators: Utilize real-life data to learn and teach financial modeling in real estate.
- Market Analysts: Gain insights into how real estate companies like Anywhere Real Estate Inc. (HOUS) are valued in the market.
What the Template Contains
- Pre-Filled Data: Includes Anywhere Real Estate Inc.'s historical financials and projections.
- Discounted Cash Flow Model: Editable DCF valuation model with automatic computations.
- Weighted Average Cost of Capital (WACC): A dedicated sheet for calculating WACC based on tailored inputs.
- Key Financial Ratios: Evaluate Anywhere Real Estate Inc.'s profitability, efficiency, and leverage.
- Customizable Inputs: Easily modify revenue growth, margins, and tax rates.
- Clear Dashboard: Visual representations and tables summarizing essential valuation outcomes.
Disclaimer
All information, articles, and product details provided on this website are for general informational and educational purposes only. We do not claim any ownership over, nor do we intend to infringe upon, any trademarks, copyrights, logos, brand names, or other intellectual property mentioned or depicted on this site. Such intellectual property remains the property of its respective owners, and any references here are made solely for identification or informational purposes, without implying any affiliation, endorsement, or partnership.
We make no representations or warranties, express or implied, regarding the accuracy, completeness, or suitability of any content or products presented. Nothing on this website should be construed as legal, tax, investment, financial, medical, or other professional advice. In addition, no part of this site—including articles or product references—constitutes a solicitation, recommendation, endorsement, advertisement, or offer to buy or sell any securities, franchises, or other financial instruments, particularly in jurisdictions where such activity would be unlawful.
All content is of a general nature and may not address the specific circumstances of any individual or entity. It is not a substitute for professional advice or services. Any actions you take based on the information provided here are strictly at your own risk. You accept full responsibility for any decisions or outcomes arising from your use of this website and agree to release us from any liability in connection with your use of, or reliance upon, the content or products found herein.