
|
Idacorp ، Inc. (IDA) تقييم DCF |
Fully Editable: Tailor To Your Needs In Excel Or Sheets
Professional Design: Trusted, Industry-Standard Templates
Investor-Approved Valuation Models
MAC/PC Compatible, Fully Unlocked
No Expertise Is Needed; Easy To Follow
IDACORP, Inc. (IDA) Bundle
اكتشف القيمة الحقيقية لـ Idacorp ، Inc. (IDA) مع حاسبة DCF المتقدمة! اضبط الافتراضات الرئيسية ، واستكشف السيناريوهات المختلفة ، وتقييم كيفية تأثير العوامل المختلفة على تقييم Idacorp - كل ذلك ضمن قالب Excel واحد.
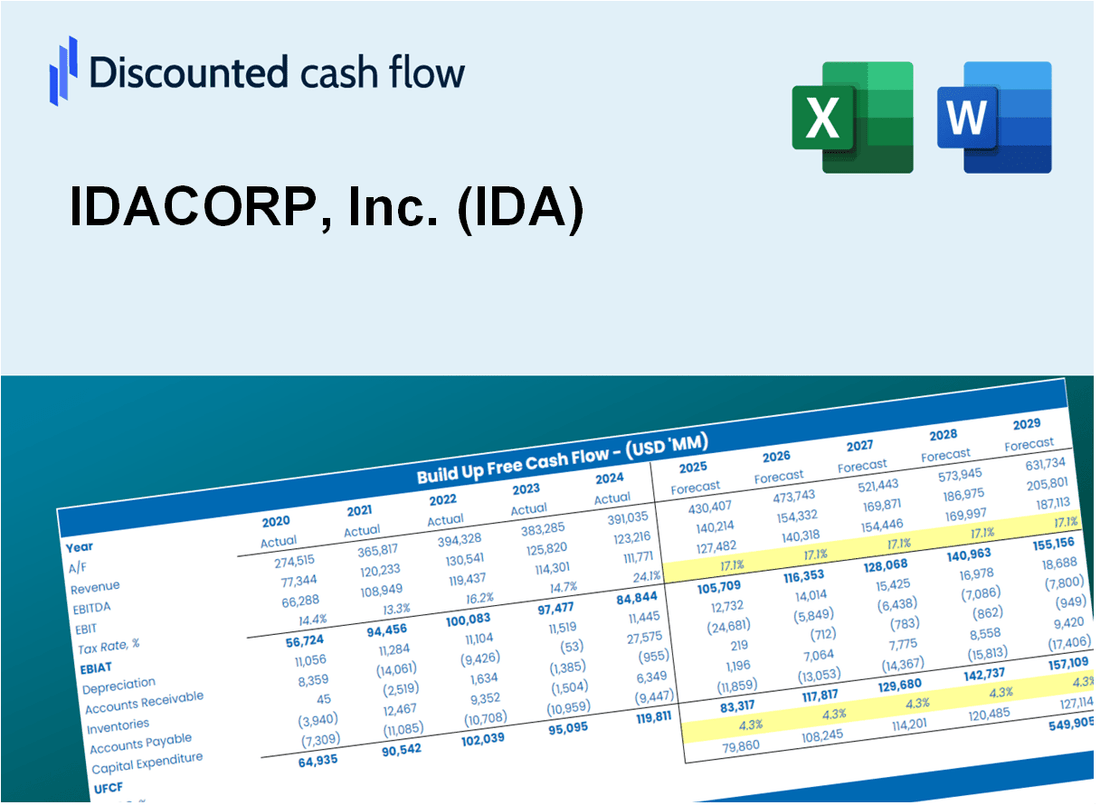
Discounted Cash Flow (DCF) - (USD MM)
| Year | AY1 2020 |
AY2 2021 |
AY3 2022 |
AY4 2023 |
AY5 2024 |
FY1 2025 |
FY2 2026 |
FY3 2027 |
FY4 2028 |
FY5 2029 |
|---|---|---|---|---|---|---|---|---|---|---|
| Revenue | 1,350.7 | 1,458.1 | 1,644.0 | 1,766.4 | 1,826.6 | 1,970.7 | 2,126.2 | 2,293.9 | 2,474.9 | 2,670.1 |
| Revenue Growth, % | 0 | 7.95 | 12.75 | 7.44 | 3.41 | 7.89 | 7.89 | 7.89 | 7.89 | 7.89 |
| EBITDA | 530.0 | 548.9 | 560.3 | 605.6 | 669.0 | 716.9 | 773.4 | 834.4 | 900.2 | 971.3 |
| EBITDA, % | 39.24 | 37.65 | 34.08 | 34.28 | 36.62 | 36.38 | 36.38 | 36.38 | 36.38 | 36.38 |
| Depreciation | 175.9 | 179.4 | 173.6 | 199.9 | 228.1 | 235.3 | 253.8 | 273.9 | 295.5 | 318.8 |
| Depreciation, % | 13.03 | 12.31 | 10.56 | 11.32 | 12.49 | 11.94 | 11.94 | 11.94 | 11.94 | 11.94 |
| EBIT | 354.1 | 369.5 | 386.8 | 405.6 | 440.9 | 481.6 | 519.6 | 560.6 | 604.8 | 652.5 |
| EBIT, % | 26.22 | 25.34 | 23.53 | 22.97 | 24.14 | 24.44 | 24.44 | 24.44 | 24.44 | 24.44 |
| Total Cash | 300.1 | 215.2 | 177.6 | 327.4 | 368.9 | 341.0 | 367.9 | 396.9 | 428.2 | 462.0 |
| Total Cash, percent | .0 | .0 | .0 | .0 | .0 | .0 | .0 | .0 | .0 | .0 |
| Account Receivables | 160.1 | 183.4 | 263.9 | 267.0 | 256.1 | 274.4 | 296.1 | 319.4 | 344.6 | 371.8 |
| Account Receivables, % | 11.85 | 12.58 | 16.06 | 15.12 | 14.02 | 13.93 | 13.93 | 13.93 | 13.93 | 13.93 |
| Inventories | 96.6 | 95.6 | 107.2 | 160.5 | 244.7 | 168.3 | 181.6 | 196.0 | 211.4 | 228.1 |
| Inventories, % | 7.15 | 6.56 | 6.52 | 9.08 | 13.4 | 8.54 | 8.54 | 8.54 | 8.54 | 8.54 |
| Accounts Payable | 120.6 | 146.0 | 292.7 | 308.5 | 307.1 | 279.9 | 302.0 | 325.8 | 351.5 | 379.3 |
| Accounts Payable, % | 8.93 | 10.01 | 17.81 | 17.47 | 16.81 | 14.2 | 14.2 | 14.2 | 14.2 | 14.2 |
| Capital Expenditure | -310.9 | -300.0 | -432.6 | -611.1 | -1,009.3 | -629.7 | -679.4 | -733.0 | -790.8 | -853.1 |
| Capital Expenditure, % | -23.02 | -20.57 | -26.31 | -34.6 | -55.25 | -31.95 | -31.95 | -31.95 | -31.95 | -31.95 |
| Tax Rate, % | 5.19 | 5.19 | 5.19 | 5.19 | 5.19 | 5.19 | 5.19 | 5.19 | 5.19 | 5.19 |
| EBITAT | 315.3 | 320.8 | 336.8 | 366.4 | 418.0 | 431.6 | 465.6 | 502.3 | 542.0 | 584.7 |
| Depreciation | ||||||||||
| Changes in Account Receivables | ||||||||||
| Changes in Inventories | ||||||||||
| Changes in Accounts Payable | ||||||||||
| Capital Expenditure | ||||||||||
| UFCF | 44.1 | 203.4 | 132.4 | -85.4 | -437.9 | 68.0 | 27.2 | 29.4 | 31.7 | 34.2 |
| WACC, % | 5.58 | 5.55 | 5.55 | 5.6 | 5.66 | 5.59 | 5.59 | 5.59 | 5.59 | 5.59 |
| PV UFCF | ||||||||||
| SUM PV UFCF | 165.4 | |||||||||
| Long Term Growth Rate, % | 3.00 | |||||||||
| Free cash flow (T + 1) | 35 | |||||||||
| Terminal Value | 1,362 | |||||||||
| Present Terminal Value | 1,037 | |||||||||
| Enterprise Value | 1,203 | |||||||||
| Net Debt | 2,705 | |||||||||
| Equity Value | -1,502 | |||||||||
| Diluted Shares Outstanding, MM | 53 | |||||||||
| Equity Value Per Share | -28.55 |
What You Will Get
- Real IDA Financials: Access to historical and projected data for precise valuation.
- Customizable Inputs: Adjust WACC, tax rates, revenue growth, and capital expenditures as needed.
- Instant Calculations: Intrinsic value and NPV are calculated in real-time.
- Scenario Analysis: Evaluate various scenarios to assess IDACORP's future performance.
- User-Friendly Design: Designed for professionals but easy for newcomers to navigate.
Key Features
- Pre-Loaded Data: IDACORP's historical financial statements and pre-filled forecasts.
- Fully Adjustable Inputs: Modify WACC, tax rates, revenue growth, and EBITDA margins as needed.
- Instant Results: Observe IDACORP's intrinsic value recalculating in real time.
- Clear Visual Outputs: Dashboard charts present valuation results and essential metrics.
- Built for Accuracy: A professional tool designed for analysts, investors, and finance professionals.
How It Works
- 1. Access the Template: Download and open the Excel file containing IDACORP, Inc.’s (IDA) preloaded data.
- 2. Adjust Assumptions: Modify key variables such as growth rates, WACC, and capital expenditures.
- 3. View Results Instantly: The DCF model automatically computes intrinsic value and NPV.
- 4. Explore Scenarios: Analyze different forecasts to evaluate various valuation outcomes.
- 5. Present with Confidence: Share professional valuation insights to back your decisions.
Why Choose This Calculator for IDACORP, Inc. (IDA)?
- Accuracy: Utilize real IDACORP financial data for precise calculations.
- Flexibility: Tailored for users to easily adjust and experiment with inputs.
- Time-Saving: Eliminate the need to create a DCF model from the ground up.
- Professional-Grade: Crafted with the expertise and usability expected at the CFO level.
- User-Friendly: Intuitive interface, suitable for both novice and experienced financial modelers.
Who Should Use This Product?
- Individual Investors: Make informed decisions about buying or selling IDACORP, Inc. (IDA) stock.
- Financial Analysts: Streamline valuation processes with ready-to-use financial models for IDACORP, Inc. (IDA).
- Consultants: Deliver professional valuation insights related to IDACORP, Inc. (IDA) to clients quickly and accurately.
- Business Owners: Understand how companies like IDACORP, Inc. (IDA) are valued to guide your own strategy.
- Finance Students: Learn valuation techniques using real-world data and scenarios involving IDACORP, Inc. (IDA).
What the Template Contains
- Pre-Filled DCF Model: IDACORP, Inc.'s (IDA) financial data preloaded for immediate use.
- WACC Calculator: Detailed calculations for Weighted Average Cost of Capital.
- Financial Ratios: Evaluate IDACORP, Inc.'s (IDA) profitability, leverage, and efficiency.
- Editable Inputs: Change assumptions such as growth, margins, and CAPEX to fit your scenarios.
- Financial Statements: Annual and quarterly reports to support detailed analysis.
- Interactive Dashboard: Easily visualize key valuation metrics and results.
Disclaimer
All information, articles, and product details provided on this website are for general informational and educational purposes only. We do not claim any ownership over, nor do we intend to infringe upon, any trademarks, copyrights, logos, brand names, or other intellectual property mentioned or depicted on this site. Such intellectual property remains the property of its respective owners, and any references here are made solely for identification or informational purposes, without implying any affiliation, endorsement, or partnership.
We make no representations or warranties, express or implied, regarding the accuracy, completeness, or suitability of any content or products presented. Nothing on this website should be construed as legal, tax, investment, financial, medical, or other professional advice. In addition, no part of this site—including articles or product references—constitutes a solicitation, recommendation, endorsement, advertisement, or offer to buy or sell any securities, franchises, or other financial instruments, particularly in jurisdictions where such activity would be unlawful.
All content is of a general nature and may not address the specific circumstances of any individual or entity. It is not a substitute for professional advice or services. Any actions you take based on the information provided here are strictly at your own risk. You accept full responsibility for any decisions or outcomes arising from your use of this website and agree to release us from any liability in connection with your use of, or reliance upon, the content or products found herein.