
|
Inhibrx ، Inc. (INBX) تقييم DCF |
Fully Editable: Tailor To Your Needs In Excel Or Sheets
Professional Design: Trusted, Industry-Standard Templates
Investor-Approved Valuation Models
MAC/PC Compatible, Fully Unlocked
No Expertise Is Needed; Easy To Follow
Inhibrx, Inc. (INBX) Bundle
عزز استراتيجيات الاستثمار الخاصة بك مع حاسبة DCF Inhibrx ، Inc. (INBX)! استكشاف البيانات المالية inhibrx الأصلية ، وضبط توقعات النمو والنفقات ، ومراقبة على الفور كيف تؤثر هذه التعديلات على القيمة الجوهرية لـ Inhibrx ، Inc. (INBX).
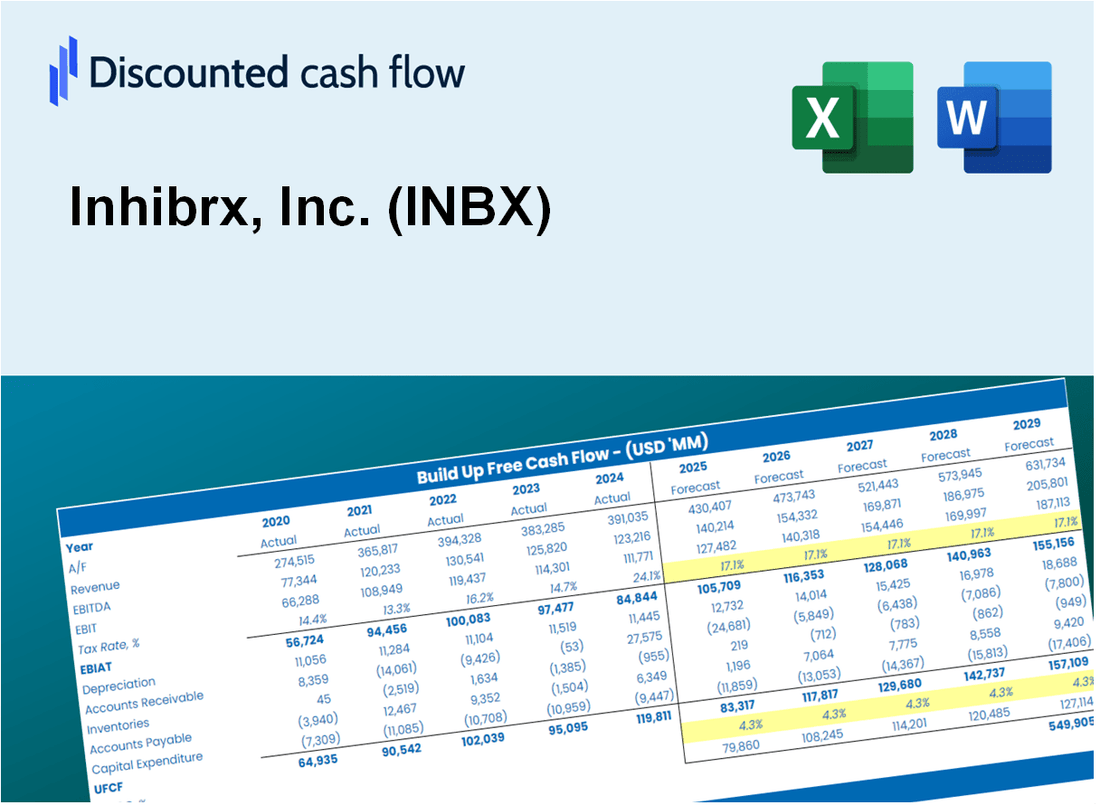
Discounted Cash Flow (DCF) - (USD MM)
| Year | AY1 2020 |
AY2 2021 |
AY3 2022 |
AY4 2023 |
AY5 2024 |
FY1 2025 |
FY2 2026 |
FY3 2027 |
FY4 2028 |
FY5 2029 |
|---|---|---|---|---|---|---|---|---|---|---|
| Revenue | 12.8 | 7.1 | 2.2 | 1.8 | .2 | .1 | .0 | .0 | .0 | .0 |
| Revenue Growth, % | 0 | -44.37 | -69.24 | -17.88 | -88.89 | -55.09 | -55.09 | -55.09 | -55.09 | -55.09 |
| EBITDA | -63.8 | -75.4 | -125.8 | -206.7 | 1,703.4 | -.1 | .0 | .0 | .0 | .0 |
| EBITDA, % | -498.12 | -1057.81 | -5739.83 | -11482.94 | 851675 | -60 | -60 | -60 | -60 | -60 |
| Depreciation | 1.0 | 1.2 | 1.2 | 1.2 | 2.3 | .0 | .0 | .0 | .0 | .0 |
| Depreciation, % | 7.96 | 16.77 | 55.89 | 66.17 | 1142.5 | 49.36 | 49.36 | 49.36 | 49.36 | 49.36 |
| EBIT | -64.8 | -76.6 | -127.0 | -207.9 | 1,701.1 | -.1 | .0 | .0 | .0 | .0 |
| EBIT, % | -506.07 | -1074.58 | -5795.71 | -11549.11 | 850532.5 | -60 | -60 | -60 | -60 | -60 |
| Total Cash | 128.7 | 131.3 | 273.9 | 277.9 | 152.6 | .1 | .0 | .0 | .0 | .0 |
| Total Cash, percent | .0 | .0 | .0 | .0 | .1 | .0 | .0 | .0 | .0 | .0 |
| Account Receivables | .6 | .9 | .3 | .8 | .4 | .0 | .0 | .0 | .0 | .0 |
| Account Receivables, % | 4.8 | 12.32 | 11.72 | 43.22 | 210 | 34.41 | 34.41 | 34.41 | 34.41 | 34.41 |
| Inventories | -129.3 | -.9 | -.3 | .0 | .0 | .0 | .0 | .0 | .0 | .0 |
| Inventories, % | -1009.36 | -12.32 | -11.72 | 0 | 0 | -24.81 | -24.81 | -24.81 | -24.81 | -24.81 |
| Accounts Payable | 13.5 | 9.1 | 8.3 | 8.3 | 9.2 | .1 | .0 | .0 | .0 | .0 |
| Accounts Payable, % | 105.07 | 128.07 | 379.84 | 461.72 | 4622.5 | 100 | 100 | 100 | 100 | 100 |
| Capital Expenditure | -1.4 | -.9 | -.7 | -4.6 | -2.6 | .0 | .0 | .0 | .0 | .0 |
| Capital Expenditure, % | -10.65 | -12.13 | -31.3 | -255.17 | -1298.5 | -50.81 | -50.81 | -50.81 | -50.81 | -50.81 |
| Tax Rate, % | 0.000118513321 | 0.000118513321 | 0.000118513321 | 0.000118513321 | 0.000118513321 | 0.000118513321 | 0.000118513321 | 0.000118513321 | 0.000118513321 | 0.000118513321 |
| EBITAT | -64.8 | -76.6 | -127.0 | -209.3 | 1,701.1 | -.1 | .0 | .0 | .0 | .0 |
| Depreciation | ||||||||||
| Changes in Account Receivables | ||||||||||
| Changes in Inventories | ||||||||||
| Changes in Accounts Payable | ||||||||||
| Capital Expenditure | ||||||||||
| UFCF | 77.0 | -209.2 | -127.3 | -213.5 | 1,702.0 | -8.8 | -.1 | .0 | .0 | .0 |
| WACC, % | 10.09 | 10.09 | 10.09 | 10.09 | 10.09 | 10.09 | 10.09 | 10.09 | 10.09 | 10.09 |
| PV UFCF | ||||||||||
| SUM PV UFCF | -8.1 | |||||||||
| Long Term Growth Rate, % | 2.00 | |||||||||
| Free cash flow (T + 1) | 0 | |||||||||
| Terminal Value | 0 | |||||||||
| Present Terminal Value | 0 | |||||||||
| Enterprise Value | -8 | |||||||||
| Net Debt | -145 | |||||||||
| Equity Value | 136 | |||||||||
| Diluted Shares Outstanding, MM | 14 | |||||||||
| Equity Value Per Share | 9.42 |
What You Will Get
- Comprehensive INBX Financials: Access to historical and projected data for precise valuation.
- Customizable Parameters: Adjust WACC, tax rates, revenue growth, and capital expenditures as needed.
- Dynamic Calculations: Intrinsic value and NPV are computed in real-time.
- Scenario Analysis: Evaluate various scenarios to assess Inhibrx’s future outlook.
- User-Friendly Interface: Designed for experts but easy to navigate for newcomers.
Key Features
- 🔍 Real-Life INBX Financials: Pre-filled historical and projected data for Inhibrx, Inc.
- ✏️ Fully Customizable Inputs: Adjust all critical parameters (yellow cells) like WACC, growth %, and tax rates.
- 📊 Professional DCF Valuation: Built-in formulas calculate Inhibrx’s intrinsic value using the Discounted Cash Flow method.
- ⚡ Instant Results: Visualize Inhibrx’s valuation instantly after making changes.
- Scenario Analysis: Test and compare outcomes for various financial assumptions side-by-side.
How It Works
- Step 1: Download the Excel file.
- Step 2: Review pre-entered Inhibrx, Inc. (INBX) data (historical and projected).
- Step 3: Adjust key assumptions (yellow cells) based on your analysis.
- Step 4: View automatic recalculations for Inhibrx, Inc. (INBX)’s intrinsic value.
- Step 5: Use the outputs for investment decisions or reporting.
Why Choose This Calculator for Inhibrx, Inc. (INBX)?
- Comprehensive Tool: Offers DCF, WACC, and financial ratio analyses tailored for Inhibrx.
- Customizable Inputs: Modify yellow-highlighted cells to explore different financial scenarios.
- Detailed Insights: Automatically computes Inhibrx’s intrinsic value and Net Present Value.
- Preloaded Data: Historical and projected data provide reliable benchmarks for analysis.
- Professional Quality: Perfect for financial analysts, investors, and business consultants focusing on Inhibrx.
Who Should Use This Product?
- Individual Investors: Make informed decisions about buying or selling Inhibrx, Inc. (INBX) stock.
- Financial Analysts: Streamline valuation processes with ready-to-use financial models for Inhibrx, Inc. (INBX).
- Consultants: Deliver professional valuation insights on Inhibrx, Inc. (INBX) to clients quickly and accurately.
- Business Owners: Understand how biotech firms like Inhibrx, Inc. (INBX) are valued to guide your own strategy.
- Finance Students: Learn valuation techniques using real-world data and scenarios related to Inhibrx, Inc. (INBX).
What the Template Contains
- Pre-Filled DCF Model: Inhibrx, Inc.'s (INBX) financial data preloaded for immediate use.
- WACC Calculator: Detailed calculations for Weighted Average Cost of Capital.
- Financial Ratios: Evaluate Inhibrx, Inc.'s (INBX) profitability, leverage, and efficiency.
- Editable Inputs: Change assumptions such as growth, margins, and CAPEX to fit your scenarios.
- Financial Statements: Annual and quarterly reports to support detailed analysis.
- Interactive Dashboard: Easily visualize key valuation metrics and results.
Disclaimer
All information, articles, and product details provided on this website are for general informational and educational purposes only. We do not claim any ownership over, nor do we intend to infringe upon, any trademarks, copyrights, logos, brand names, or other intellectual property mentioned or depicted on this site. Such intellectual property remains the property of its respective owners, and any references here are made solely for identification or informational purposes, without implying any affiliation, endorsement, or partnership.
We make no representations or warranties, express or implied, regarding the accuracy, completeness, or suitability of any content or products presented. Nothing on this website should be construed as legal, tax, investment, financial, medical, or other professional advice. In addition, no part of this site—including articles or product references—constitutes a solicitation, recommendation, endorsement, advertisement, or offer to buy or sell any securities, franchises, or other financial instruments, particularly in jurisdictions where such activity would be unlawful.
All content is of a general nature and may not address the specific circumstances of any individual or entity. It is not a substitute for professional advice or services. Any actions you take based on the information provided here are strictly at your own risk. You accept full responsibility for any decisions or outcomes arising from your use of this website and agree to release us from any liability in connection with your use of, or reliance upon, the content or products found herein.