
|
الهند Cements Limited (Indiacem.NS) تقييم DCF |
Fully Editable: Tailor To Your Needs In Excel Or Sheets
Professional Design: Trusted, Industry-Standard Templates
Investor-Approved Valuation Models
MAC/PC Compatible, Fully Unlocked
No Expertise Is Needed; Easy To Follow
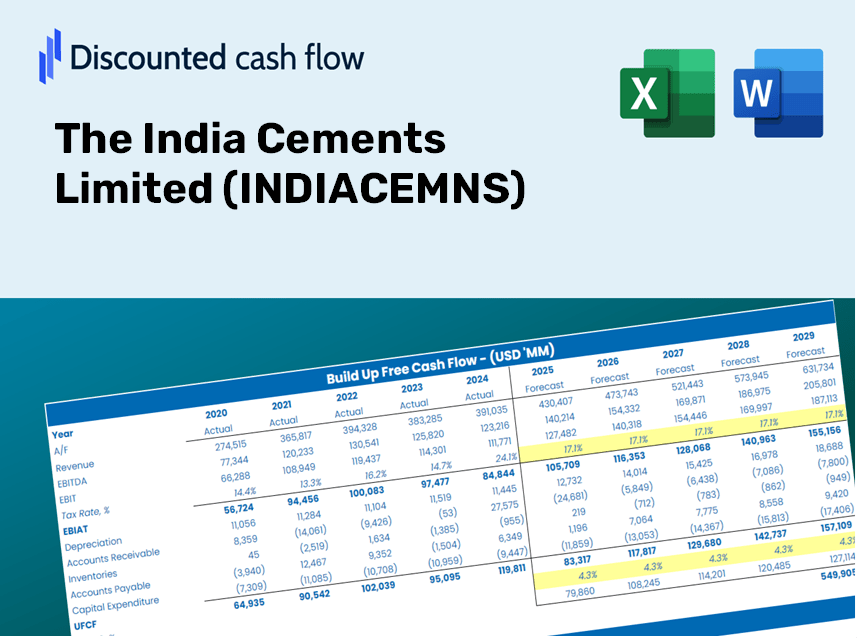
The India Cements Limited (INDIACEM.NS) Bundle
تبسيط تحليلك وتحسين الدقة مع حاسبة (Indiacemns) DCF! مزودًا ببيانات حقيقية من افتراضات India Cements Limited و Evanivable ، تمكنك هذه الأداة من التنبؤ وتحليل وقيمة (Indiacemns) تمامًا مثل المستثمر المحنك.
Discounted Cash Flow (DCF) - (USD MM)
| Year | AY1 2021 |
AY2 2022 |
AY3 2023 |
AY4 2024 |
AY5 2025 |
FY1 2026 |
FY2 2027 |
FY3 2028 |
FY4 2029 |
FY5 2030 |
|---|---|---|---|---|---|---|---|---|---|---|
| Revenue | 45,105.5 | 48,583.5 | 56,081.4 | 49,978.5 | 41,487.8 | 40,997.5 | 40,513.0 | 40,034.2 | 39,561.1 | 39,093.5 |
| Revenue Growth, % | 0 | 7.71 | 15.43 | -10.88 | -16.99 | -1.18 | -1.18 | -1.18 | -1.18 | -1.18 |
| EBITDA | 7,759.8 | 4,778.3 | -1,419.0 | -232.7 | -4,814.2 | 1,020.0 | 1,007.9 | 996.0 | 984.2 | 972.6 |
| EBITDA, % | 17.2 | 9.84 | -2.53 | -0.46551 | -11.6 | 2.49 | 2.49 | 2.49 | 2.49 | 2.49 |
| Depreciation | 2,300.7 | 2,126.3 | 2,192.7 | 993.1 | 1,043.7 | 1,466.9 | 1,449.5 | 1,432.4 | 1,415.5 | 1,398.8 |
| Depreciation, % | 5.1 | 4.38 | 3.91 | 1.99 | 2.52 | 3.58 | 3.58 | 3.58 | 3.58 | 3.58 |
| EBIT | 5,459.1 | 2,652.0 | -3,611.7 | -1,225.7 | -5,857.9 | -446.9 | -441.6 | -436.4 | -431.3 | -426.2 |
| EBIT, % | 12.1 | 5.46 | -6.44 | -2.45 | -14.12 | -1.09 | -1.09 | -1.09 | -1.09 | -1.09 |
| Total Cash | 419.6 | 502.5 | 688.4 | 852.5 | 1,052.0 | 609.5 | 602.3 | 595.2 | 588.2 | 581.2 |
| Total Cash, percent | .0 | .0 | .0 | .0 | .0 | .0 | .0 | .0 | .0 | .0 |
| Account Receivables | 6,077.6 | 10,159.3 | 19,705.5 | 15,377.1 | 6,912.7 | 9,589.5 | 9,476.1 | 9,364.1 | 9,253.5 | 9,144.1 |
| Account Receivables, % | 13.47 | 20.91 | 35.14 | 30.77 | 16.66 | 23.39 | 23.39 | 23.39 | 23.39 | 23.39 |
| Inventories | 6,637.4 | 9,172.2 | 7,846.6 | 6,305.1 | 6,078.1 | 6,137.5 | 6,064.9 | 5,993.3 | 5,922.4 | 5,852.4 |
| Inventories, % | 14.72 | 18.88 | 13.99 | 12.62 | 14.65 | 14.97 | 14.97 | 14.97 | 14.97 | 14.97 |
| Accounts Payable | 9,530.4 | 12,964.8 | 13,323.9 | 12,445.6 | 9,819.6 | 9,851.1 | 9,734.7 | 9,619.7 | 9,506.0 | 9,393.6 |
| Accounts Payable, % | 21.13 | 26.69 | 23.76 | 24.9 | 23.67 | 24.03 | 24.03 | 24.03 | 24.03 | 24.03 |
| Capital Expenditure | -1,653.5 | -1,684.6 | -576.7 | -1,273.3 | -624.3 | -1,001.5 | -989.7 | -978.0 | -966.4 | -955.0 |
| Capital Expenditure, % | -3.67 | -3.47 | -1.03 | -2.55 | -1.5 | -2.44 | -2.44 | -2.44 | -2.44 | -2.44 |
| Tax Rate, % | 21.43 | 21.43 | 21.43 | 21.43 | 21.43 | 21.43 | 21.43 | 21.43 | 21.43 | 21.43 |
| EBITAT | 3,624.9 | 1,950.7 | -1,376.4 | -1,001.1 | -4,602.8 | -302.4 | -298.8 | -295.3 | -291.8 | -288.4 |
| Depreciation | ||||||||||
| Changes in Account Receivables | ||||||||||
| Changes in Inventories | ||||||||||
| Changes in Accounts Payable | ||||||||||
| Capital Expenditure | ||||||||||
| UFCF | 1,087.6 | -789.9 | -7,622.0 | 3,710.4 | 1,882.1 | -2,541.7 | 230.5 | 227.8 | 225.1 | 222.4 |
| WACC, % | 5.55 | 5.68 | 5.01 | 5.83 | 5.77 | 5.57 | 5.57 | 5.57 | 5.57 | 5.57 |
| PV UFCF | ||||||||||
| SUM PV UFCF | -1,656.3 | |||||||||
| Long Term Growth Rate, % | 2.00 | |||||||||
| Free cash flow (T + 1) | 227 | |||||||||
| Terminal Value | 6,357 | |||||||||
| Present Terminal Value | 4,848 | |||||||||
| Enterprise Value | 3,192 | |||||||||
| Net Debt | 10,610 | |||||||||
| Equity Value | -7,418 | |||||||||
| Diluted Shares Outstanding, MM | 310 | |||||||||
| Equity Value Per Share | -23.94 |
فوائدك مع الهند Cements Limited (Indiacemns)
- البيانات المالية Indiacemns الأصلية: يوفر كل من المقاييس التاريخية والتنبؤية للتقييم الدقيق.
- المعلمات القابلة للتخصيص: ضبط المدخلات مثل WACC ، ومعدلات الضرائب ، ونمو الإيرادات ، والنفقات الرأسمالية.
- الحسابات في الوقت الحقيقي: الحساب الديناميكي للقيمة الجوهرية و NPV.
- تقييم السيناريو: قم بتحليل السيناريوهات المختلفة لتقييم آفاق الهند المستقبلية للهند.
- واجهة سهلة الاستخدام: مصمم للمهنيين في هذا المجال مع بقاء متناول القادمين الجدد.
الميزات الرئيسية
- 🔍 واقعية إندياكمنم المالية: بيانات تاريخية ومتوقعة مملوءة مسبقًا للهند المحدودة.
- ✏️ مدخلات قابلة للتخصيص بالكامل: اضبط جميع المعلمات الهامة (الخلايا الصفراء) مثل WACC و Growth ٪ ومعدلات الضرائب.
- 📊 تقييم DCF المهني: الصيغ المدمجة تحسب القيمة الجوهرية للهند Cement Cements Limited باستخدام طريقة التدفق النقدي المخفض.
- ⚡ النتائج الفورية: تصور تقييم الهند Cements Limited فور تطبيق التغييرات.
- تحليل السيناريو: تقييم ومقارنة النتائج لمختلف الافتراضات المالية جنبًا إلى جنب.
كيف تعمل
- تحميل: احصل على ملف Excel جاهز للاستخدام الذي يتميز بالبيانات المالية لـ India Cement Cements (Indiacemns).
- تخصيص: تخصيص توقعاتك ، بما في ذلك نمو الإيرادات ، EBITDA ٪ ، و WACC لتفضيلاتك.
- التحديث تلقائيًا: شاهد كقيمة جوهرية وحسابات NPV تحديث في الوقت الفعلي.
- سيناريوهات الاختبار: توليد توقعات مختلفة ومقارنة النتائج على الفور.
- اتخاذ القرارات: الاستفادة من نتائج التقييم لإبلاغ استراتيجيات الاستثمار الخاصة بك.
لماذا حدد هذه الآلة الحاسبة لـ India Cements Limited (Indiacemns)؟
- مصمم للخبراء: أداة متطورة يستخدمها المحللون والمدير المالي والمستشارون في الصناعة.
- رؤى مالية دقيقة: إن الهند Cems Cements Limited التاريخية والبيانات المالية المتوقعة مسبقًا للدقة.
- تحليل السيناريو المرن: اختبار دون عناء التنبؤات والافتراضات.
- مخرجات شاملة: يحسب تلقائيًا القيمة الجوهرية ، NPV ، والمقاييس المالية الأساسية.
- واجهة سهلة الاستخدام: يضمن التوجيه خطوة بخطوة تجربة سلسة خلال عملية الحساب.
من يجب أن يفكر في استخدام Indiacemns؟
- طلاب التمويل: اكتشف تقنيات التقييم وتطبيقها باستخدام بيانات السوق الفعلية.
- الباحثون: دمج النماذج المعيارية للصناعة في المشاريع الأكاديمية أو الدراسات.
- المستثمرون: التحقق من صحة افتراضاتك وتقييم نتائج التقييم للهند الأسمنت المحدودة (Indiacemns).
- المحللون الماليون: تعزيز الكفاءة مع نموذج DCF قابل للتخصيص مصمم خصيصًا لـ India Cements Limited.
- أصحاب الأعمال الصغيرة: افهم مدى تقييم الشركات الكبيرة مثل India Cements Limited في السوق.
محتويات القالب
- نموذج DCF الشامل: قالب قابل للتحرير يتميز بحسابات تقييم شاملة.
- بيانات العالم الحقيقي: إن الهند Cements Limited (Indiacemns) التاريخي والمواتية المتوقعة المدرجة للتحليل.
- المعلمات القابلة للتخصيص: تعديل WACC ومعدلات النمو والافتراضات الضريبية لاستكشاف السيناريوهات المختلفة.
- البيانات المالية: انهيار سنوي وفصلي مفصل للتفاصيل المحسنة.
- النسب الرئيسية: تحليل متكامل للربحية والكفاءة والتقييمات المالية.
- لوحة القيادة مع المخرجات المرئية: الرسوم البيانية والجداول للرؤى الواضحة القابلة للتنفيذ.
Disclaimer
All information, articles, and product details provided on this website are for general informational and educational purposes only. We do not claim any ownership over, nor do we intend to infringe upon, any trademarks, copyrights, logos, brand names, or other intellectual property mentioned or depicted on this site. Such intellectual property remains the property of its respective owners, and any references here are made solely for identification or informational purposes, without implying any affiliation, endorsement, or partnership.
We make no representations or warranties, express or implied, regarding the accuracy, completeness, or suitability of any content or products presented. Nothing on this website should be construed as legal, tax, investment, financial, medical, or other professional advice. In addition, no part of this site—including articles or product references—constitutes a solicitation, recommendation, endorsement, advertisement, or offer to buy or sell any securities, franchises, or other financial instruments, particularly in jurisdictions where such activity would be unlawful.
All content is of a general nature and may not address the specific circumstances of any individual or entity. It is not a substitute for professional advice or services. Any actions you take based on the information provided here are strictly at your own risk. You accept full responsibility for any decisions or outcomes arising from your use of this website and agree to release us from any liability in connection with your use of, or reliance upon, the content or products found herein.