
|
تقييم Infinera Corporation (INFN) DCF |
Fully Editable: Tailor To Your Needs In Excel Or Sheets
Professional Design: Trusted, Industry-Standard Templates
Investor-Approved Valuation Models
MAC/PC Compatible, Fully Unlocked
No Expertise Is Needed; Easy To Follow
Infinera Corporation (INFN) Bundle
اكتشف القيمة الحقيقية لشركة Infinera Corporation (INFN) باستخدام حاسبة DCF من الدرجة المهنية! قم بتعديل الافتراضات الرئيسية، واستكشاف السيناريوهات المختلفة، وتقييم كيفية تأثير التغييرات على تقييم Infinera Corporation - كل ذلك ضمن نموذج Excel واحد.
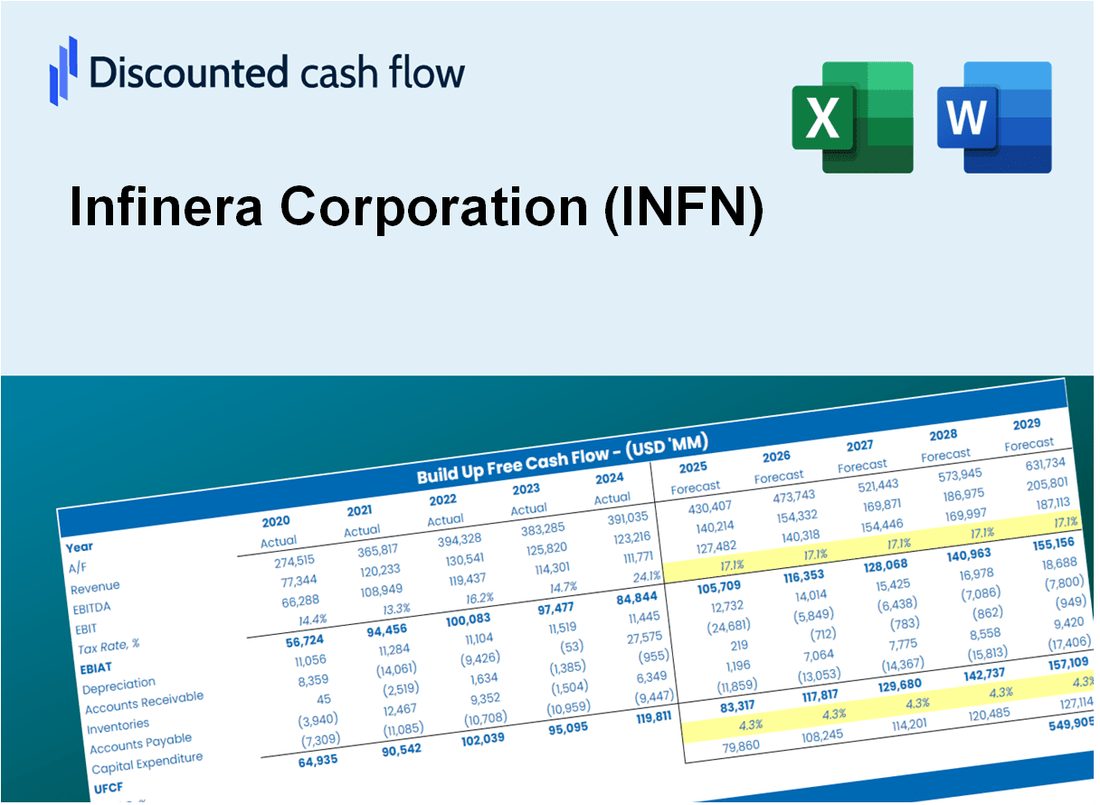
Discounted Cash Flow (DCF) - (USD MM)
| Year | AY1 2020 |
AY2 2021 |
AY3 2022 |
AY4 2023 |
AY5 2024 |
FY1 2025 |
FY2 2026 |
FY3 2027 |
FY4 2028 |
FY5 2029 |
|---|---|---|---|---|---|---|---|---|---|---|
| Revenue | 1,355.6 | 1,425.2 | 1,573.2 | 1,614.1 | 1,418.4 | 1,439.7 | 1,461.3 | 1,483.2 | 1,505.5 | 1,528.0 |
| Revenue Growth, % | 0 | 5.13 | 10.39 | 2.6 | -12.12 | 1.5 | 1.5 | 1.5 | 1.5 | 1.5 |
| EBITDA | -35.3 | -11.1 | 63.8 | 92.0 | -83.7 | 1.4 | 1.4 | 1.4 | 1.4 | 1.4 |
| EBITDA, % | -2.6 | -0.77989 | 4.05 | 5.7 | -5.9 | 0.09453015 | 0.09453015 | 0.09453015 | 0.09453015 | 0.09453015 |
| Depreciation | 118.7 | 98.6 | 93.3 | 78.8 | 62.3 | 88.9 | 90.2 | 91.6 | 93.0 | 94.4 |
| Depreciation, % | 8.76 | 6.92 | 5.93 | 4.88 | 4.39 | 6.18 | 6.18 | 6.18 | 6.18 | 6.18 |
| EBIT | -154.0 | -109.7 | -29.5 | 13.2 | -146.0 | -87.5 | -88.9 | -90.2 | -91.5 | -92.9 |
| EBIT, % | -11.36 | -7.7 | -1.87 | 0.81784 | -10.29 | -6.08 | -6.08 | -6.08 | -6.08 | -6.08 |
| Total Cash | 298.0 | 190.6 | 178.7 | 172.5 | 145.8 | 194.9 | 197.8 | 200.8 | 203.8 | 206.8 |
| Total Cash, percent | .0 | .0 | .0 | .0 | .0 | .0 | .0 | .0 | .0 | .0 |
| Account Receivables | 319.4 | 359.0 | 419.7 | 382.0 | 336.6 | 353.7 | 359.0 | 364.3 | 369.8 | 375.3 |
| Account Receivables, % | 23.56 | 25.19 | 26.68 | 23.66 | 23.73 | 24.56 | 24.56 | 24.56 | 24.56 | 24.56 |
| Inventories | 269.3 | 291.4 | 374.9 | 431.2 | 308.2 | 324.2 | 329.0 | 334.0 | 339.0 | 344.0 |
| Inventories, % | 19.87 | 20.44 | 23.83 | 26.71 | 21.73 | 22.52 | 22.52 | 22.52 | 22.52 | 22.52 |
| Accounts Payable | 175.8 | 216.4 | 304.9 | 299.0 | 285.0 | 248.0 | 251.8 | 255.5 | 259.4 | 263.3 |
| Accounts Payable, % | 12.97 | 15.18 | 19.38 | 18.52 | 20.09 | 17.23 | 17.23 | 17.23 | 17.23 | 17.23 |
| Capital Expenditure | -39.0 | -41.4 | -46.1 | -62.3 | -75.0 | -51.4 | -52.2 | -53.0 | -53.8 | -54.6 |
| Capital Expenditure, % | -2.88 | -2.9 | -2.93 | -3.86 | -5.29 | -3.57 | -3.57 | -3.57 | -3.57 | -3.57 |
| Tax Rate, % | -13.01 | -13.01 | -13.01 | -13.01 | -13.01 | -13.01 | -13.01 | -13.01 | -13.01 | -13.01 |
| EBITAT | -158.6 | -118.0 | -40.4 | 19.1 | -165.0 | -87.5 | -88.9 | -90.2 | -91.5 | -92.9 |
| Depreciation | ||||||||||
| Changes in Account Receivables | ||||||||||
| Changes in Inventories | ||||||||||
| Changes in Accounts Payable | ||||||||||
| Capital Expenditure | ||||||||||
| UFCF | -491.9 | -81.7 | -49.0 | 11.2 | -23.3 | -120.1 | -57.3 | -58.1 | -59.0 | -59.9 |
| WACC, % | 13.63 | 13.63 | 13.63 | 13.63 | 13.63 | 13.63 | 13.63 | 13.63 | 13.63 | 13.63 |
| PV UFCF | ||||||||||
| SUM PV UFCF | -256.6 | |||||||||
| Long Term Growth Rate, % | 4.00 | |||||||||
| Free cash flow (T + 1) | -62 | |||||||||
| Terminal Value | -647 | |||||||||
| Present Terminal Value | -342 | |||||||||
| Enterprise Value | -598 | |||||||||
| Net Debt | -104 | |||||||||
| Equity Value | -494 | |||||||||
| Diluted Shares Outstanding, MM | 235 | |||||||||
| Equity Value Per Share | -2.11 |
What You Will Get
- Real Infinera Data: Preloaded financials – from revenue to EBIT – based on actual and projected figures.
- Full Customization: Adjust all critical parameters (yellow cells) like WACC, growth %, and tax rates.
- Instant Valuation Updates: Automatic recalculations to analyze the impact of changes on Infinera’s fair value.
- Versatile Excel Template: Tailored for quick edits, scenario testing, and detailed projections.
- Time-Saving and Accurate: Skip building models from scratch while maintaining precision and flexibility.
Key Features
- Comprehensive Infinera Financials: Gain access to precise pre-loaded historical data and future forecasts.
- Adjustable Forecast Parameters: Modify the highlighted fields such as WACC, growth rates, and profit margins.
- Real-Time Calculations: Automatic updates for DCF, Net Present Value (NPV), and cash flow assessments.
- Interactive Dashboard: User-friendly charts and summaries to help visualize your valuation outcomes.
- Suitable for All Skill Levels: A straightforward, intuitive layout designed for investors, CFOs, and consultants.
How It Works
- Download: Obtain the pre-configured Excel file containing Infinera Corporation’s (INFN) financial data.
- Customize: Modify projections, such as revenue growth, EBITDA %, and WACC.
- Update Automatically: The intrinsic value and NPV calculations refresh in real-time.
- Test Scenarios: Generate various projections and analyze results instantly.
- Make Decisions: Leverage the valuation findings to inform your investment strategy.
Why Choose This Calculator for Infinera Corporation (INFN)?
- User-Friendly Interface: Tailored for both novices and seasoned professionals.
- Customizable Inputs: Adjust parameters to suit your specific analysis needs.
- Real-Time Valuation: Instantly observe changes to Infinera’s valuation as you modify inputs.
- Preloaded Data: Comes with Infinera’s actual financial figures for immediate evaluation.
- Relied Upon by Experts: Favored by investors and analysts for making well-informed decisions.
Who Should Use This Product?
- Investors: Evaluate Infinera Corporation’s (INFN) valuation prior to making investment decisions.
- CFOs and Financial Analysts: Enhance valuation methodologies and assess financial forecasts.
- Startup Founders: Understand the valuation strategies of established tech companies like Infinera Corporation.
- Consultants: Provide comprehensive valuation analyses and reports for clients in the tech sector.
- Students and Educators: Utilize current data to explore and teach valuation practices in finance.
What the Infinera Template Contains
- Preloaded INFN Data: Historical and projected financial data, including revenue, EBIT, and capital expenditures.
- DCF and WACC Models: Professional-grade sheets for calculating intrinsic value and Weighted Average Cost of Capital.
- Editable Inputs: Yellow-highlighted cells for adjusting revenue growth, tax rates, and discount rates.
- Financial Statements: Comprehensive annual and quarterly financials for deeper analysis.
- Key Ratios: Profitability, leverage, and efficiency ratios to evaluate performance.
- Dashboard and Charts: Visual summaries of valuation outcomes and assumptions.
Disclaimer
All information, articles, and product details provided on this website are for general informational and educational purposes only. We do not claim any ownership over, nor do we intend to infringe upon, any trademarks, copyrights, logos, brand names, or other intellectual property mentioned or depicted on this site. Such intellectual property remains the property of its respective owners, and any references here are made solely for identification or informational purposes, without implying any affiliation, endorsement, or partnership.
We make no representations or warranties, express or implied, regarding the accuracy, completeness, or suitability of any content or products presented. Nothing on this website should be construed as legal, tax, investment, financial, medical, or other professional advice. In addition, no part of this site—including articles or product references—constitutes a solicitation, recommendation, endorsement, advertisement, or offer to buy or sell any securities, franchises, or other financial instruments, particularly in jurisdictions where such activity would be unlawful.
All content is of a general nature and may not address the specific circumstances of any individual or entity. It is not a substitute for professional advice or services. Any actions you take based on the information provided here are strictly at your own risk. You accept full responsibility for any decisions or outcomes arising from your use of this website and agree to release us from any liability in connection with your use of, or reliance upon, the content or products found herein.