
|
Summit Hotel Properties ، Inc. (Inn) DCF تقييم |
Fully Editable: Tailor To Your Needs In Excel Or Sheets
Professional Design: Trusted, Industry-Standard Templates
Investor-Approved Valuation Models
MAC/PC Compatible, Fully Unlocked
No Expertise Is Needed; Easy To Follow
Summit Hotel Properties, Inc. (INN) Bundle
قم بتحسين وقتك وتحسين الدقة من خلال حاسبة [رمز] DCF لدينا! باستخدام بيانات Real Summit Hotel Properties ، Inc. وافتراضات قابلة للتخصيص ، فإن هذه الأداة تمكنك من التنبؤ وتحليل وتقدير فندق Summit Hotel Properties ، Inc. (Inn) مثل المستثمر المخضرم.
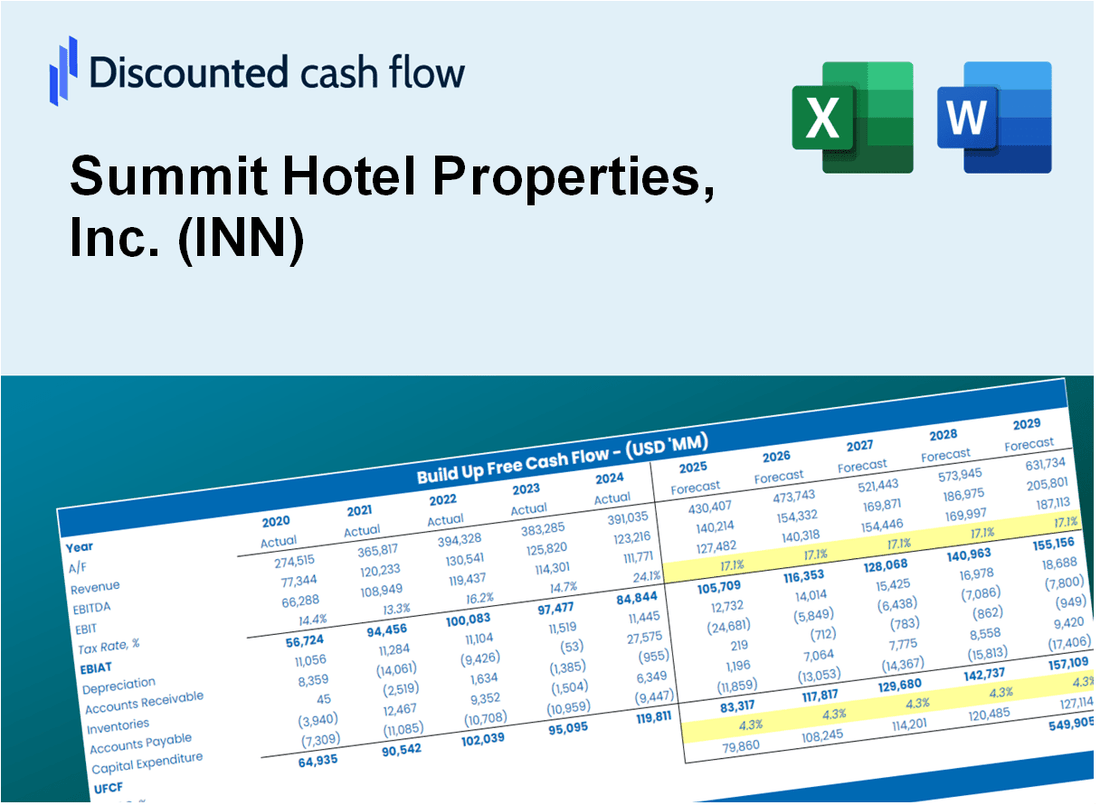
Discounted Cash Flow (DCF) - (USD MM)
| Year | AY1 2020 |
AY2 2021 |
AY3 2022 |
AY4 2023 |
AY5 2024 |
FY1 2025 |
FY2 2026 |
FY3 2027 |
FY4 2028 |
FY5 2029 |
|---|---|---|---|---|---|---|---|---|---|---|
| Revenue | 234.5 | 361.9 | 675.7 | 736.1 | 731.8 | 1,005.1 | 1,380.6 | 1,896.3 | 2,604.6 | 3,577.4 |
| Revenue Growth, % | 0 | 54.36 | 86.69 | 8.94 | -0.59012 | 37.35 | 37.35 | 37.35 | 37.35 | 37.35 |
| EBITDA | 5.1 | 82.2 | 220.6 | 212.4 | 259.2 | 244.8 | 336.3 | 461.9 | 634.4 | 871.4 |
| EBITDA, % | 2.15 | 22.72 | 32.64 | 28.85 | 35.42 | 24.36 | 24.36 | 24.36 | 24.36 | 24.36 |
| Depreciation | 109.6 | 106.0 | 150.2 | 150.9 | 146.4 | 279.0 | 383.1 | 526.3 | 722.8 | 992.8 |
| Depreciation, % | 46.75 | 29.28 | 22.22 | 20.5 | 20.01 | 27.75 | 27.75 | 27.75 | 27.75 | 27.75 |
| EBIT | -104.6 | -23.7 | 70.4 | 61.5 | 112.8 | -34.1 | -46.9 | -64.4 | -88.4 | -121.5 |
| EBIT, % | -44.6 | -6.56 | 10.42 | 8.35 | 15.41 | -3.4 | -3.4 | -3.4 | -3.4 | -3.4 |
| Total Cash | 20.7 | 64.5 | 51.3 | 37.8 | 40.6 | 90.3 | 124.1 | 170.4 | 234.1 | 321.5 |
| Total Cash, percent | .0 | .0 | .0 | .0 | .0 | .0 | .0 | .0 | .0 | .0 |
| Account Receivables | 35.5 | 14.5 | 21.0 | 21.3 | 19.8 | 56.0 | 76.9 | 105.6 | 145.0 | 199.2 |
| Account Receivables, % | 15.13 | 4 | 3.11 | 2.9 | 2.7 | 5.57 | 5.57 | 5.57 | 5.57 | 5.57 |
| Inventories | .0 | .0 | .0 | .0 | .0 | .0 | .0 | .0 | .0 | .0 |
| Inventories, % | 0 | 0 | 0 | 0 | 0 | 0 | 0 | 0 | 0 | 0 |
| Accounts Payable | 2.7 | 4.5 | 5.5 | 4.8 | 7.5 | 9.8 | 13.4 | 18.4 | 25.3 | 34.8 |
| Accounts Payable, % | 1.14 | 1.23 | 0.81649 | 0.65573 | 1.02 | 0.97272 | 0.97272 | 0.97272 | 0.97272 | 0.97272 |
| Capital Expenditure | -22.6 | -20.4 | -76.5 | -89.6 | -89.3 | -102.5 | -140.7 | -193.3 | -265.5 | -364.7 |
| Capital Expenditure, % | -9.65 | -5.62 | -11.32 | -12.17 | -12.2 | -10.19 | -10.19 | -10.19 | -10.19 | -10.19 |
| Tax Rate, % | -44.76 | -44.76 | -44.76 | -44.76 | -44.76 | -44.76 | -44.76 | -44.76 | -44.76 | -44.76 |
| EBITAT | -101.4 | -23.2 | 21.4 | 23.0 | 163.3 | -24.7 | -34.0 | -46.7 | -64.1 | -88.1 |
| Depreciation | ||||||||||
| Changes in Account Receivables | ||||||||||
| Changes in Inventories | ||||||||||
| Changes in Accounts Payable | ||||||||||
| Capital Expenditure | ||||||||||
| UFCF | -47.2 | 85.2 | 89.6 | 83.4 | 224.6 | 117.9 | 191.2 | 262.6 | 360.7 | 495.4 |
| WACC, % | 7.03 | 7.06 | 4.45 | 4.73 | 7.15 | 6.08 | 6.08 | 6.08 | 6.08 | 6.08 |
| PV UFCF | ||||||||||
| SUM PV UFCF | 1,154.6 | |||||||||
| Long Term Growth Rate, % | 4.00 | |||||||||
| Free cash flow (T + 1) | 515 | |||||||||
| Terminal Value | 24,741 | |||||||||
| Present Terminal Value | 18,416 | |||||||||
| Enterprise Value | 19,571 | |||||||||
| Net Debt | 1,381 | |||||||||
| Equity Value | 18,190 | |||||||||
| Diluted Shares Outstanding, MM | 132 | |||||||||
| Equity Value Per Share | 137.42 |
What You Will Get
- Real Summit Hotel Data: Preloaded financials – from revenue to EBIT – based on actual and projected figures for Summit Hotel Properties, Inc. (INN).
- Full Customization: Adjust all critical parameters (yellow cells) such as WACC, growth %, and tax rates to fit your analysis.
- Instant Valuation Updates: Automatic recalculations to assess the impact of changes on Summit Hotel Properties, Inc.'s (INN) fair value.
- Versatile Excel Template: Designed for quick edits, scenario testing, and detailed projections specific to the hospitality sector.
- Time-Saving and Accurate: Avoid building models from the ground up while ensuring precision and flexibility in your assessments.
Key Features
- Customizable Financial Inputs: Adjust essential metrics such as occupancy rates, average daily rates, and operating expenses.
- Instant DCF Valuation: Quickly computes intrinsic value, NPV, and additional financial metrics.
- High-Precision Accuracy: Leverages Summit Hotel Properties' (INN) actual financial data for credible valuation results.
- Effortless Scenario Analysis: Explore various assumptions and evaluate results with ease.
- Efficiency Booster: Avoid the hassle of constructing intricate valuation models from the ground up.
How It Works
- Step 1: Download the Excel file.
- Step 2: Review pre-entered Summit Hotel Properties, Inc. (INN) data (historical and projected).
- Step 3: Adjust key assumptions (yellow cells) based on your analysis.
- Step 4: View automatic recalculations for Summit Hotel Properties, Inc. (INN) intrinsic value.
- Step 5: Use the outputs for investment decisions or reporting.
Why Choose This Calculator for Summit Hotel Properties, Inc. (INN)?
- Accuracy: Utilizes real Summit Hotel financials to ensure precise data.
- Flexibility: Users can easily test and modify inputs as needed.
- Time-Saving: Avoid the complexities of creating a DCF model from the ground up.
- Professional-Grade: Crafted with the precision and usability expected at the CFO level.
- User-Friendly: Intuitive design makes it accessible for users with limited financial modeling experience.
Who Should Use This Product?
- Investors: Accurately assess Summit Hotel Properties, Inc.'s (INN) fair value prior to making investment choices.
- CFOs: Utilize a high-quality DCF model for financial reporting and analysis related to Summit Hotel Properties, Inc. (INN).
- Consultants: Efficiently modify the template for valuation reports tailored to clients interested in Summit Hotel Properties, Inc. (INN).
- Entrepreneurs: Acquire knowledge about financial modeling techniques employed by leading hotel management firms.
- Educators: Implement it as a teaching resource to illustrate valuation methodologies in the hospitality industry.
What the Template Contains
- Operating and Balance Sheet Data: Pre-filled Summit Hotel Properties, Inc. (INN) historical data and forecasts, including revenue, EBITDA, EBIT, and capital expenditures.
- WACC Calculation: A dedicated sheet for Weighted Average Cost of Capital (WACC), including parameters like Beta, risk-free rate, and share price.
- DCF Valuation (Unlevered and Levered): Editable Discounted Cash Flow models showing intrinsic value with detailed calculations.
- Financial Statements: Pre-loaded financial statements (annual and quarterly) to support analysis.
- Key Ratios: Includes profitability, leverage, and efficiency ratios for Summit Hotel Properties, Inc. (INN).
- Dashboard and Charts: Visual summary of valuation outputs and assumptions to analyze results easily.
Disclaimer
All information, articles, and product details provided on this website are for general informational and educational purposes only. We do not claim any ownership over, nor do we intend to infringe upon, any trademarks, copyrights, logos, brand names, or other intellectual property mentioned or depicted on this site. Such intellectual property remains the property of its respective owners, and any references here are made solely for identification or informational purposes, without implying any affiliation, endorsement, or partnership.
We make no representations or warranties, express or implied, regarding the accuracy, completeness, or suitability of any content or products presented. Nothing on this website should be construed as legal, tax, investment, financial, medical, or other professional advice. In addition, no part of this site—including articles or product references—constitutes a solicitation, recommendation, endorsement, advertisement, or offer to buy or sell any securities, franchises, or other financial instruments, particularly in jurisdictions where such activity would be unlawful.
All content is of a general nature and may not address the specific circumstances of any individual or entity. It is not a substitute for professional advice or services. Any actions you take based on the information provided here are strictly at your own risk. You accept full responsibility for any decisions or outcomes arising from your use of this website and agree to release us from any liability in connection with your use of, or reliance upon, the content or products found herein.