
|
TERUM Therapeutics PLC (ITRM) DCF تقييم |
Fully Editable: Tailor To Your Needs In Excel Or Sheets
Professional Design: Trusted, Industry-Standard Templates
Investor-Approved Valuation Models
MAC/PC Compatible, Fully Unlocked
No Expertise Is Needed; Easy To Follow
Iterum Therapeutics plc (ITRM) Bundle
اكتشف الإمكانات الحقيقية للعلاج التكراري PLC (ITRM) مع حاسبة DCF المتقدمة لدينا! اضبط الافتراضات الأساسية ، واستكشاف السيناريوهات المختلفة ، وتقييم تأثيرات التغييرات على تقييم Teerum Therapeutics PLC (ITRM) - كل ذلك ضمن قالب Excel مناسب.
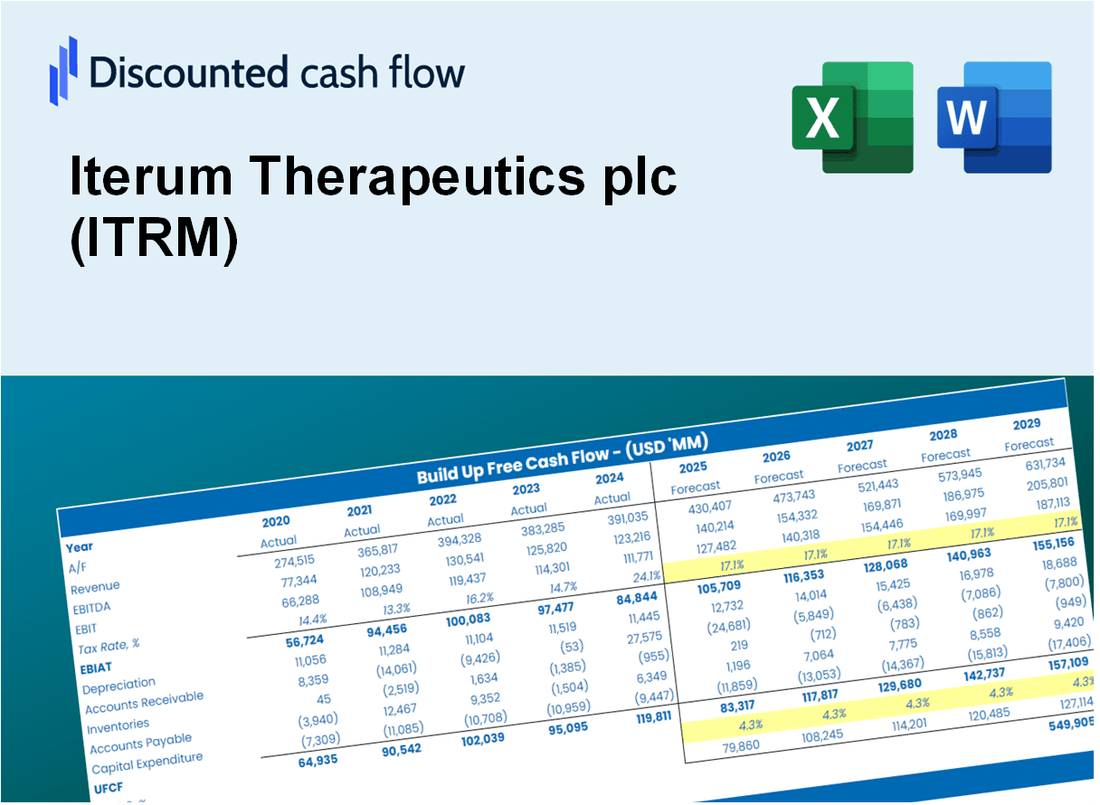
Discounted Cash Flow (DCF) - (USD MM)
| Year | AY1 2020 |
AY2 2021 |
AY3 2022 |
AY4 2023 |
AY5 2024 |
FY1 2025 |
FY2 2026 |
FY3 2027 |
FY4 2028 |
FY5 2029 |
|---|---|---|---|---|---|---|---|---|---|---|
| Revenue | .0 | .0 | .0 | .0 | .0 | .0 | .0 | .0 | .0 | .0 |
| Revenue Growth, % | 0 | 0 | 0 | 0 | 0 | 0 | 0 | 0 | 0 | 0 |
| EBITDA | -36.0 | -83.2 | -40.0 | -34.6 | -18.7 | .0 | .0 | .0 | .0 | .0 |
| EBITDA, % | 100 | 100 | 100 | 100 | 100 | 100 | 100 | 100 | 100 | 100 |
| Depreciation | .2 | 2.1 | 1.8 | 1.8 | .3 | .0 | .0 | .0 | .0 | .0 |
| Depreciation, % | 100 | 100 | 100 | 100 | 100 | 100 | 100 | 100 | 100 | 100 |
| EBIT | -36.2 | -85.3 | -41.8 | -36.3 | -19.0 | .0 | .0 | .0 | .0 | .0 |
| EBIT, % | 100 | 100 | 100 | 100 | 100 | 100 | 100 | 100 | 100 | 100 |
| Total Cash | 14.5 | 81.3 | 60.8 | 23.9 | 24.1 | .0 | .0 | .0 | .0 | .0 |
| Total Cash, percent | .0 | .0 | .0 | .0 | .0 | .0 | .0 | .0 | .0 | .0 |
| Account Receivables | .9 | 1.2 | .0 | .2 | .1 | .0 | .0 | .0 | .0 | .0 |
| Account Receivables, % | 100 | 100 | 100 | 100 | 100 | 100 | 100 | 100 | 100 | 100 |
| Inventories | -3.7 | -3.1 | -1.9 | .0 | .0 | .0 | .0 | .0 | .0 | .0 |
| Inventories, % | 100 | 100 | 100 | 100 | 100 | 100 | 100 | 100 | 100 | 100 |
| Accounts Payable | .8 | .9 | 2.8 | 5.0 | .3 | .0 | .0 | .0 | .0 | .0 |
| Accounts Payable, % | 100 | 100 | 100 | 100 | 100 | 100 | 100 | 100 | 100 | 100 |
| Capital Expenditure | .0 | -.1 | -.1 | .0 | .0 | .0 | .0 | .0 | .0 | .0 |
| Capital Expenditure, % | 100 | 100 | 100 | 100 | 100 | 0 | 0 | 0 | 0 | 0 |
| Tax Rate, % | -0.97823 | -0.97823 | -0.97823 | -0.97823 | -0.97823 | -0.97823 | -0.97823 | -0.97823 | -0.97823 | -0.97823 |
| EBITAT | -36.7 | -86.0 | -42.1 | -36.9 | -19.2 | .0 | .0 | .0 | .0 | .0 |
| Depreciation | ||||||||||
| Changes in Account Receivables | ||||||||||
| Changes in Inventories | ||||||||||
| Changes in Accounts Payable | ||||||||||
| Capital Expenditure | ||||||||||
| UFCF | -32.8 | -84.8 | -38.5 | -35.0 | -23.5 | -.2 | .0 | .0 | .0 | .0 |
| WACC, % | 7.14 | 7.14 | 7.14 | 7.14 | 7.14 | 7.14 | 7.14 | 7.14 | 7.14 | 7.14 |
| PV UFCF | ||||||||||
| SUM PV UFCF | -.2 | |||||||||
| Long Term Growth Rate, % | 2.00 | |||||||||
| Free cash flow (T + 1) | 0 | |||||||||
| Terminal Value | 0 | |||||||||
| Present Terminal Value | 0 | |||||||||
| Enterprise Value | 0 | |||||||||
| Net Debt | 21 | |||||||||
| Equity Value | -22 | |||||||||
| Diluted Shares Outstanding, MM | 20 | |||||||||
| Equity Value Per Share | -1.10 |
What You Will Receive
- Customizable Excel Template: A fully editable Excel-based DCF Calculator featuring pre-filled real ITRM financials.
- Actual Data: Historical figures and forward-looking projections (highlighted in the yellow cells).
- Forecast Adaptability: Modify forecast assumptions such as revenue growth, EBITDA %, and WACC.
- Instant Calculations: Quickly observe the effects of your inputs on Iterum Therapeutics' valuation.
- Professional Resource: Designed for investors, CFOs, consultants, and financial analysts.
- User-Centric Layout: Organized for clarity and ease of navigation, complete with step-by-step guidance.
Key Features
- Comprehensive ITRM Data: Pre-loaded with Iterum Therapeutics' historical performance metrics and future projections.
- Customizable Variables: Modify assumptions for revenue growth, profit margins, discount rates, tax implications, and capital investments.
- Interactive Valuation Framework: Automatically recalculates Net Present Value (NPV) and intrinsic value based on your adjustments.
- Scenario Analysis: Develop various forecasting scenarios to explore different valuation possibilities.
- User-Centric Interface: Intuitive, organized, and suitable for both industry experts and newcomers.
How It Works
- Download the Template: Gain immediate access to the Excel-based ITRM DCF Calculator.
- Input Your Assumptions: Modify the yellow-highlighted cells for growth rates, WACC, margins, and additional parameters.
- Instant Calculations: The model automatically recalculates Iterum Therapeutics' intrinsic value.
- Test Scenarios: Experiment with varying assumptions to assess potential changes in valuation.
- Analyze and Decide: Utilize the results to inform your investment or financial analysis.
Why Choose This Calculator for Iterum Therapeutics plc (ITRM)?
- Comprehensive Tool: Integrates DCF, WACC, and financial ratio analyses tailored for Iterum Therapeutics.
- Customizable Inputs: Modify yellow-highlighted cells to explore different financial scenarios for (ITRM).
- Detailed Insights: Automatically computes Iterum’s intrinsic value and Net Present Value for informed decision-making.
- Preloaded Data: Features historical and projected data for (ITRM) to provide reliable starting points.
- Professional Quality: Perfect for financial analysts, investors, and consultants focused on Iterum Therapeutics.
Who Should Use This Product?
- Individual Investors: Make informed decisions about buying or selling Iterum Therapeutics plc (ITRM) stock.
- Financial Analysts: Streamline valuation processes with ready-to-use financial models for Iterum Therapeutics plc (ITRM).
- Consultants: Deliver professional valuation insights on Iterum Therapeutics plc (ITRM) to clients quickly and accurately.
- Business Owners: Understand how biotech companies like Iterum Therapeutics plc (ITRM) are valued to guide your own strategy.
- Finance Students: Learn valuation techniques using real-world data and scenarios related to Iterum Therapeutics plc (ITRM).
What the Template Contains
- Operating and Balance Sheet Data: Pre-filled Iterum Therapeutics plc (ITRM) historical data and forecasts, including revenue, EBITDA, EBIT, and capital expenditures.
- WACC Calculation: A dedicated sheet for Weighted Average Cost of Capital (WACC), including parameters like Beta, risk-free rate, and share price.
- DCF Valuation (Unlevered and Levered): Editable Discounted Cash Flow models showing intrinsic value with detailed calculations.
- Financial Statements: Pre-loaded financial statements (annual and quarterly) to support analysis.
- Key Ratios: Includes profitability, leverage, and efficiency ratios for Iterum Therapeutics plc (ITRM).
- Dashboard and Charts: Visual summary of valuation outputs and assumptions to analyze results easily.
Disclaimer
All information, articles, and product details provided on this website are for general informational and educational purposes only. We do not claim any ownership over, nor do we intend to infringe upon, any trademarks, copyrights, logos, brand names, or other intellectual property mentioned or depicted on this site. Such intellectual property remains the property of its respective owners, and any references here are made solely for identification or informational purposes, without implying any affiliation, endorsement, or partnership.
We make no representations or warranties, express or implied, regarding the accuracy, completeness, or suitability of any content or products presented. Nothing on this website should be construed as legal, tax, investment, financial, medical, or other professional advice. In addition, no part of this site—including articles or product references—constitutes a solicitation, recommendation, endorsement, advertisement, or offer to buy or sell any securities, franchises, or other financial instruments, particularly in jurisdictions where such activity would be unlawful.
All content is of a general nature and may not address the specific circumstances of any individual or entity. It is not a substitute for professional advice or services. Any actions you take based on the information provided here are strictly at your own risk. You accept full responsibility for any decisions or outcomes arising from your use of this website and agree to release us from any liability in connection with your use of, or reliance upon, the content or products found herein.