
|
Jerash Holdings (US) ، Inc. (JRSH) DCF تقييم |
Fully Editable: Tailor To Your Needs In Excel Or Sheets
Professional Design: Trusted, Industry-Standard Templates
Investor-Approved Valuation Models
MAC/PC Compatible, Fully Unlocked
No Expertise Is Needed; Easy To Follow
Jerash Holdings (US), Inc. (JRSH) Bundle
تبسيط التقييم Jerash Holdings (US) ، Inc. (JRSH) مع هذه الآلة الحاسبة DCF القابلة للتخصيص! يضم Real Jerash Holdings (US) ، Inc. (JRSH) ومدخلات التنبؤ القابلة للتعديل ، يمكنك اختبار السيناريوهات وكشف Jerash Holdings (US) ، Inc. (JRSH) القيمة العادلة في دقائق.
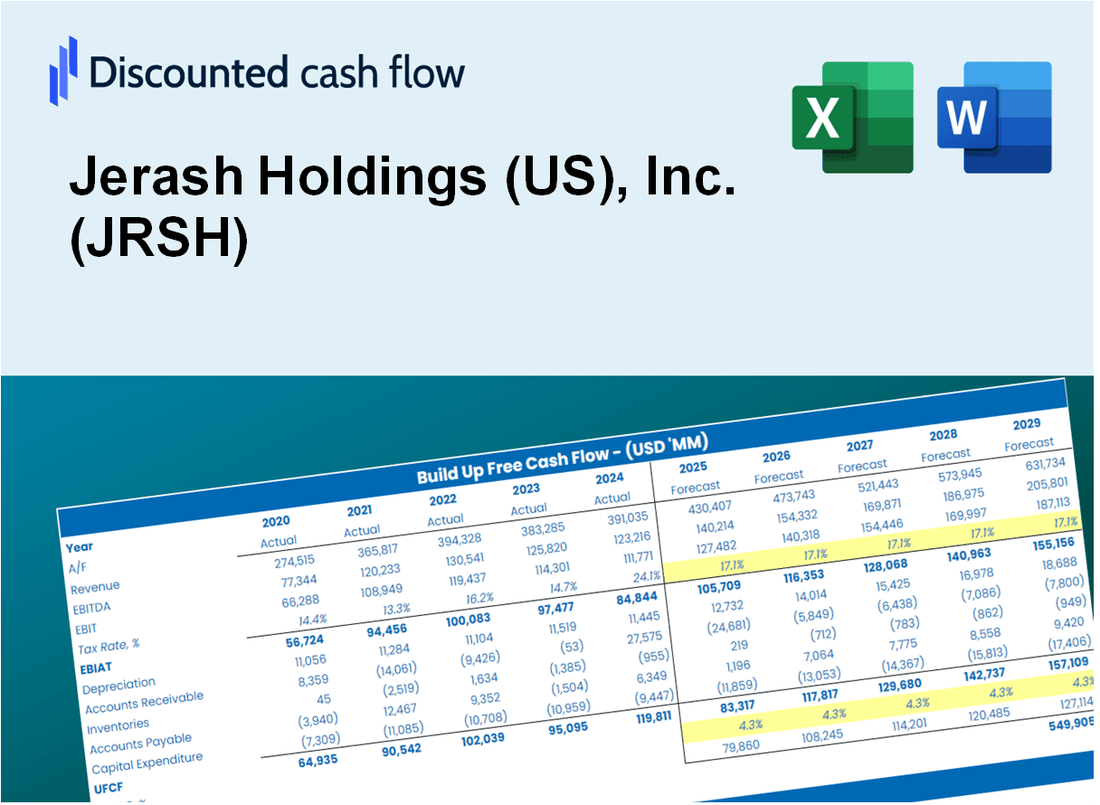
Discounted Cash Flow (DCF) - (USD MM)
| Year | AY1 2020 |
AY2 2021 |
AY3 2022 |
AY4 2023 |
AY5 2024 |
FY1 2025 |
FY2 2026 |
FY3 2027 |
FY4 2028 |
FY5 2029 |
|---|---|---|---|---|---|---|---|---|---|---|
| Revenue | 90.2 | 143.4 | 138.1 | 117.2 | 145.8 | 154.3 | 163.4 | 172.9 | 183.0 | 193.7 |
| Revenue Growth, % | 0 | 58.91 | -3.69 | -15.12 | 24.43 | 5.84 | 5.84 | 5.84 | 5.84 | 5.84 |
| EBITDA | 7.9 | 13.4 | 8.3 | 3.1 | 5.1 | 9.4 | 9.9 | 10.5 | 11.1 | 11.8 |
| EBITDA, % | 8.8 | 9.38 | 5.99 | 2.67 | 3.53 | 6.07 | 6.07 | 6.07 | 6.07 | 6.07 |
| Depreciation | 2.6 | 3.0 | 3.4 | 3.3 | 3.3 | 3.8 | 4.1 | 4.3 | 4.5 | 4.8 |
| Depreciation, % | 2.83 | 2.06 | 2.48 | 2.82 | 2.25 | 2.49 | 2.49 | 2.49 | 2.49 | 2.49 |
| EBIT | 5.4 | 10.5 | 4.9 | -.2 | 1.9 | 5.5 | 5.9 | 6.2 | 6.6 | 7.0 |
| EBIT, % | 5.97 | 7.32 | 3.51 | -0.14151 | 1.28 | 3.59 | 3.59 | 3.59 | 3.59 | 3.59 |
| Total Cash | 21.1 | 25.7 | 17.8 | 12.4 | 13.3 | 22.8 | 24.2 | 25.6 | 27.1 | 28.7 |
| Total Cash, percent | .0 | .0 | .0 | .0 | .0 | .0 | .0 | .0 | .0 | .0 |
| Account Receivables | 12.4 | 11.4 | 2.3 | 5.4 | 3.1 | 9.3 | 9.8 | 10.4 | 11.0 | 11.7 |
| Account Receivables, % | 13.76 | 7.97 | 1.69 | 4.62 | 2.11 | 6.03 | 6.03 | 6.03 | 6.03 | 6.03 |
| Inventories | 25.0 | 28.3 | 32.7 | 27.2 | 27,704.8 | 60.0 | 63.5 | 67.2 | 71.1 | 75.3 |
| Inventories, % | 27.75 | 19.71 | 23.65 | 23.25 | 19000.38 | 38.87 | 38.87 | 38.87 | 38.87 | 38.87 |
| Accounts Payable | 7.9 | 4.8 | 5.8 | 6.3 | 6.5 | 8.1 | 8.6 | 9.1 | 9.6 | 10.2 |
| Accounts Payable, % | 8.78 | 3.38 | 4.19 | 5.41 | 4.46 | 5.24 | 5.24 | 5.24 | 5.24 | 5.24 |
| Capital Expenditure | -.9 | -5.1 | -5.8 | -4.8 | -2.0 | -4.4 | -4.7 | -4.9 | -5.2 | -5.5 |
| Capital Expenditure, % | -0.98706 | -3.53 | -4.21 | -4.13 | -1.4 | -2.85 | -2.85 | -2.85 | -2.85 | -2.85 |
| Tax Rate, % | 661.12 | 661.12 | 661.12 | 661.12 | 661.12 | 661.12 | 661.12 | 661.12 | 661.12 | 661.12 |
| EBITAT | 4.1 | 8.0 | 2.9 | -.2 | -10.5 | 3.4 | 3.6 | 3.9 | 4.1 | 4.3 |
| Depreciation | ||||||||||
| Changes in Account Receivables | ||||||||||
| Changes in Inventories | ||||||||||
| Changes in Accounts Payable | ||||||||||
| Capital Expenditure | ||||||||||
| UFCF | -23.8 | .5 | 6.1 | 1.1 | -27,684.3 | 27,643.1 | -.5 | -.6 | -.6 | -.6 |
| WACC, % | 10.38 | 10.39 | 9.79 | 11.28 | 7.62 | 9.89 | 9.89 | 9.89 | 9.89 | 9.89 |
| PV UFCF | ||||||||||
| SUM PV UFCF | 25,153.0 | |||||||||
| Long Term Growth Rate, % | 3.50 | |||||||||
| Free cash flow (T + 1) | -1 | |||||||||
| Terminal Value | -10 | |||||||||
| Present Terminal Value | -6 | |||||||||
| Enterprise Value | 25,147 | |||||||||
| Net Debt | -8 | |||||||||
| Equity Value | 25,155 | |||||||||
| Diluted Shares Outstanding, MM | 12 | |||||||||
| Equity Value Per Share | 2,040.30 |
What You Will Receive
- Customizable Excel Template: A fully adjustable Excel-based DCF Calculator featuring pre-filled real JRSH financials.
- Authentic Data: Historical performance metrics and future projections (as highlighted in the yellow cells).
- Assumption Flexibility: Modify forecast parameters such as revenue growth, EBITDA margin, and WACC.
- Instant Calculations: Quickly observe how your inputs influence Jerash Holdings' valuation.
- Professional Resource: Designed for investors, CFOs, consultants, and financial analysts.
- Intuitive Interface: Organized for clarity and ease of navigation, complete with step-by-step guidance.
Key Features
- Comprehensive Financial Data: Access Jerash Holdings' historical financial statements and pre-filled projections.
- Customizable Parameters: Adjust WACC, tax rates, revenue growth, and EBITDA margins to fit your analysis.
- Real-Time Valuation: Observe Jerash Holdings' intrinsic value update instantly as you modify inputs.
- Intuitive Visualizations: Dashboard charts present valuation outcomes and essential metrics clearly.
- Designed for Precision: A reliable tool tailored for analysts, investors, and financial professionals.
How It Works
- Download the Template: Get instant access to the Excel-based JRSH DCF Calculator.
- Input Your Assumptions: Adjust yellow-highlighted cells for growth rates, WACC, margins, and more.
- Instant Calculations: The model automatically updates Jerash Holdings' intrinsic value.
- Test Scenarios: Simulate different assumptions to evaluate potential valuation changes.
- Analyze and Decide: Use the results to guide your investment or financial analysis.
Why Choose This Calculator for Jerash Holdings (US), Inc. (JRSH)?
- Comprehensive Tool: Incorporates DCF, WACC, and financial ratio analyses all in one solution.
- Customizable Inputs: Modify yellow-highlighted cells to explore different financial scenarios.
- Detailed Insights: Automatically computes Jerash Holdings’ intrinsic value and Net Present Value.
- Preloaded Data: Historical and projected data provide reliable starting points for analysis.
- Professional Quality: Perfect for financial analysts, investors, and business consultants focusing on JRSH.
Who Should Use This Product?
- Investors: Evaluate Jerash Holdings (US), Inc. (JRSH) before making trading decisions.
- CFOs and Financial Analysts: Optimize valuation methodologies and assess financial forecasts.
- Startup Founders: Understand the valuation strategies of established companies like Jerash Holdings (US), Inc. (JRSH).
- Consultants: Create comprehensive valuation reports for your clientele.
- Students and Educators: Utilize current data for hands-on learning of valuation practices.
What the Template Contains
- Pre-Filled DCF Model: Jerash Holdings' financial data preloaded for immediate use.
- WACC Calculator: Detailed calculations for Weighted Average Cost of Capital.
- Financial Ratios: Evaluate Jerash Holdings' profitability, leverage, and efficiency.
- Editable Inputs: Change assumptions such as growth, margins, and CAPEX to fit your scenarios.
- Financial Statements: Annual and quarterly reports to support detailed analysis.
- Interactive Dashboard: Easily visualize key valuation metrics and results.
Disclaimer
All information, articles, and product details provided on this website are for general informational and educational purposes only. We do not claim any ownership over, nor do we intend to infringe upon, any trademarks, copyrights, logos, brand names, or other intellectual property mentioned or depicted on this site. Such intellectual property remains the property of its respective owners, and any references here are made solely for identification or informational purposes, without implying any affiliation, endorsement, or partnership.
We make no representations or warranties, express or implied, regarding the accuracy, completeness, or suitability of any content or products presented. Nothing on this website should be construed as legal, tax, investment, financial, medical, or other professional advice. In addition, no part of this site—including articles or product references—constitutes a solicitation, recommendation, endorsement, advertisement, or offer to buy or sell any securities, franchises, or other financial instruments, particularly in jurisdictions where such activity would be unlawful.
All content is of a general nature and may not address the specific circumstances of any individual or entity. It is not a substitute for professional advice or services. Any actions you take based on the information provided here are strictly at your own risk. You accept full responsibility for any decisions or outcomes arising from your use of this website and agree to release us from any liability in connection with your use of, or reliance upon, the content or products found herein.