
|
The Combor Corp. (Jynt) DCF تقييم |
Fully Editable: Tailor To Your Needs In Excel Or Sheets
Professional Design: Trusted, Industry-Standard Templates
Investor-Approved Valuation Models
MAC/PC Compatible, Fully Unlocked
No Expertise Is Needed; Easy To Follow
The Joint Corp. (JYNT) Bundle
تقييم الآفاق المالية لشركة المشتركة مثل خبير! توفر لك حاسبة DCF (Jynt) هذه البيانات المالية المليئة مسبقًا والمرونة الكاملة لتعديل نمو الإيرادات ، و WACC ، والهوامش ، وغيرها من الافتراضات الحاسمة التي تتماشى مع توقعاتك.
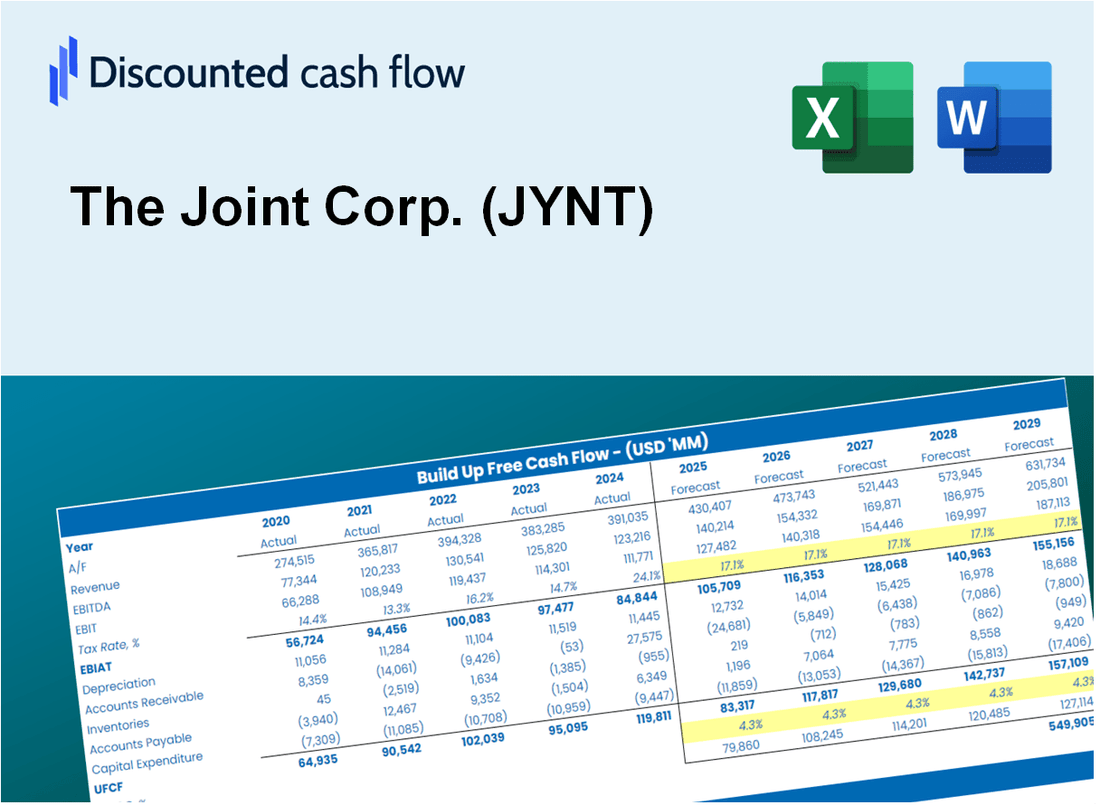
Discounted Cash Flow (DCF) - (USD MM)
| Year | AY1 2020 |
AY2 2021 |
AY3 2022 |
AY4 2023 |
AY5 2024 |
FY1 2025 |
FY2 2026 |
FY3 2027 |
FY4 2028 |
FY5 2029 |
|---|---|---|---|---|---|---|---|---|---|---|
| Revenue | 58.7 | 80.0 | 101.3 | 47.0 | 51.9 | 54.5 | 57.2 | 60.0 | 62.9 | 66.0 |
| Revenue Growth, % | 0 | 36.34 | 26.55 | -53.6 | 10.47 | 4.94 | 4.94 | 4.94 | 4.94 | 4.94 |
| EBITDA | 8.2 | 10.1 | 7.9 | 1.6 | 3.0 | 4.7 | 5.0 | 5.2 | 5.5 | 5.7 |
| EBITDA, % | 13.93 | 12.59 | 7.79 | 3.35 | 5.75 | 8.68 | 8.68 | 8.68 | 8.68 | 8.68 |
| Depreciation | 2.7 | 3.9 | 6.6 | 1.3 | 4.7 | 3.0 | 3.2 | 3.4 | 3.5 | 3.7 |
| Depreciation, % | 4.66 | 4.9 | 6.56 | 2.72 | 9.1 | 5.59 | 5.59 | 5.59 | 5.59 | 5.59 |
| EBIT | 5.4 | 6.2 | 1.2 | .3 | -1.7 | 1.7 | 1.8 | 1.9 | 1.9 | 2.0 |
| EBIT, % | 9.27 | 7.69 | 1.22 | 0.63308 | -3.35 | 3.09 | 3.09 | 3.09 | 3.09 | 3.09 |
| Total Cash | 20.6 | 19.5 | 9.7 | 18.2 | 25.1 | 17.0 | 17.8 | 18.7 | 19.6 | 20.6 |
| Total Cash, percent | .0 | .0 | .0 | .0 | .0 | .0 | .0 | .0 | .0 | .0 |
| Account Receivables | 2.1 | 3.7 | 3.9 | 3.7 | 2.6 | 2.7 | 2.8 | 3.0 | 3.1 | 3.3 |
| Account Receivables, % | 3.52 | 4.63 | 3.86 | 7.92 | 4.98 | 4.98 | 4.98 | 4.98 | 4.98 | 4.98 |
| Inventories | 1.2 | 1.4 | 1.9 | .0 | .0 | .6 | .6 | .7 | .7 | .7 |
| Inventories, % | 1.98 | 1.73 | 1.84 | 0 | 0 | 1.11 | 1.11 | 1.11 | 1.11 | 1.11 |
| Accounts Payable | 1.6 | 1.7 | 3.0 | 1.3 | 1.8 | 1.5 | 1.6 | 1.7 | 1.7 | 1.8 |
| Accounts Payable, % | 2.66 | 2.13 | 2.93 | 2.67 | 3.37 | 2.75 | 2.75 | 2.75 | 2.75 | 2.75 |
| Capital Expenditure | -4.2 | -8.4 | -8.8 | -5.0 | -1.2 | -4.3 | -4.5 | -4.7 | -4.9 | -5.2 |
| Capital Expenditure, % | -7.15 | -10.47 | -8.67 | -10.64 | -2.28 | -7.84 | -7.84 | -7.84 | -7.84 | -7.84 |
| Tax Rate, % | -478.38 | -478.38 | -478.38 | -478.38 | -478.38 | -478.38 | -478.38 | -478.38 | -478.38 | -478.38 |
| EBITAT | 13.2 | 7.7 | 1.1 | -11.4 | -10.1 | 1.3 | 1.4 | 1.4 | 1.5 | 1.6 |
| Depreciation | ||||||||||
| Changes in Account Receivables | ||||||||||
| Changes in Inventories | ||||||||||
| Changes in Accounts Payable | ||||||||||
| Capital Expenditure | ||||||||||
| UFCF | 10.1 | 1.5 | -.4 | -14.8 | -4.9 | -.9 | .0 | .0 | .0 | .0 |
| WACC, % | 10.55 | 10.55 | 10.55 | 10.53 | 10.55 | 10.54 | 10.54 | 10.54 | 10.54 | 10.54 |
| PV UFCF | ||||||||||
| SUM PV UFCF | -.8 | |||||||||
| Long Term Growth Rate, % | 2.00 | |||||||||
| Free cash flow (T + 1) | 0 | |||||||||
| Terminal Value | 0 | |||||||||
| Present Terminal Value | 0 | |||||||||
| Enterprise Value | -1 | |||||||||
| Net Debt | -25 | |||||||||
| Equity Value | 24 | |||||||||
| Diluted Shares Outstanding, MM | 15 | |||||||||
| Equity Value Per Share | 1.57 |
What You Will Receive
- Adjustable Forecast Parameters: Modify key assumptions (growth %, margins, WACC) to explore various scenarios.
- Comprehensive Data: The Joint Corp.'s financial information pre-loaded to facilitate your analysis.
- Instant DCF Calculations: The template automatically computes Net Present Value (NPV) and intrinsic value.
- Tailored and Professional Design: A refined Excel model that meets your valuation requirements.
- Designed for Analysts and Investors: Perfect for evaluating projections, confirming strategies, and enhancing efficiency.
Key Features
- Comprehensive Financial Data: The Joint Corp.'s historical financial statements and projected forecasts.
- Customizable Parameters: Modify WACC, tax rates, revenue growth, and EBITDA margins as needed.
- Real-Time Valuation: Observe The Joint Corp.'s intrinsic value update instantly.
- Intuitive Visualizations: Dashboard graphs illustrate valuation results and essential metrics.
- Designed for Precision: A reliable tool for analysts, investors, and finance professionals.
How It Works
- Step 1: Download the Excel file.
- Step 2: Review pre-entered The Joint Corp. (JYNT) data (historical and projected).
- Step 3: Adjust key assumptions (yellow cells) based on your analysis.
- Step 4: View automatic recalculations for The Joint Corp.'s (JYNT) intrinsic value.
- Step 5: Use the outputs for investment decisions or reporting.
Why Choose This Calculator for The Joint Corp. (JYNT)?
- Accuracy: Utilizes real financial data from The Joint Corp. for precise calculations.
- Flexibility: Allows users to easily test and adjust inputs as needed.
- Time-Saving: Eliminate the tedious process of constructing a DCF model from the ground up.
- Professional-Grade: Crafted with the expertise and usability expected by CFOs.
- User-Friendly: Intuitive design ensures accessibility for users with varying levels of financial modeling skills.
Who Should Use This Product?
- Finance Students: Understand the intricacies of valuation methods and apply them using real-world data.
- Academics: Integrate industry-standard models into your teaching or research projects.
- Investors: Validate your investment strategies and evaluate the valuation metrics for The Joint Corp. (JYNT).
- Analysts: Enhance your analysis process with a ready-to-use, customizable DCF model tailored for The Joint Corp. (JYNT).
- Small Business Owners: Discover how established public companies like The Joint Corp. (JYNT) are assessed in the market.
What the Template Contains
- Historical Data: Includes The Joint Corp.'s (JYNT) past financials and baseline forecasts.
- DCF and Levered DCF Models: Detailed templates to calculate The Joint Corp.'s (JYNT) intrinsic value.
- WACC Sheet: Pre-built calculations for Weighted Average Cost of Capital.
- Editable Inputs: Modify key drivers like growth rates, EBITDA %, and CAPEX assumptions.
- Quarterly and Annual Statements: A complete breakdown of The Joint Corp.'s (JYNT) financials.
- Interactive Dashboard: Visualize valuation results and projections dynamically.
Disclaimer
All information, articles, and product details provided on this website are for general informational and educational purposes only. We do not claim any ownership over, nor do we intend to infringe upon, any trademarks, copyrights, logos, brand names, or other intellectual property mentioned or depicted on this site. Such intellectual property remains the property of its respective owners, and any references here are made solely for identification or informational purposes, without implying any affiliation, endorsement, or partnership.
We make no representations or warranties, express or implied, regarding the accuracy, completeness, or suitability of any content or products presented. Nothing on this website should be construed as legal, tax, investment, financial, medical, or other professional advice. In addition, no part of this site—including articles or product references—constitutes a solicitation, recommendation, endorsement, advertisement, or offer to buy or sell any securities, franchises, or other financial instruments, particularly in jurisdictions where such activity would be unlawful.
All content is of a general nature and may not address the specific circumstances of any individual or entity. It is not a substitute for professional advice or services. Any actions you take based on the information provided here are strictly at your own risk. You accept full responsibility for any decisions or outcomes arising from your use of this website and agree to release us from any liability in connection with your use of, or reliance upon, the content or products found herein.