
|
Kubient ، Inc. (KBNT) تقييم DCF |
Fully Editable: Tailor To Your Needs In Excel Or Sheets
Professional Design: Trusted, Industry-Standard Templates
Investor-Approved Valuation Models
MAC/PC Compatible, Fully Unlocked
No Expertise Is Needed; Easy To Follow
Kubient, Inc. (KBNT) Bundle
Simplify Kubient ، Inc. (KBNT) التقييم مع هذه الآلة الحاسبة DCF القابلة للتخصيص! يضم Real Kubient ، Inc. (KBNT) ماليات ومدخلات تنبؤات قابلة للتعديل ، يمكنك اختبار السيناريوهات وتكشف القيمة العادلة Kubient ، Inc. (KBNT) في دقائق.
Discounted Cash Flow (DCF) - (USD MM)
| Year | AY1 2018 |
AY2 2019 |
AY3 2020 |
AY4 2021 |
AY5 2022 |
FY1 2023 |
FY2 2024 |
FY3 2025 |
FY4 2026 |
FY5 2027 |
|---|---|---|---|---|---|---|---|---|---|---|
| Revenue | .1 | .2 | 2.9 | 2.7 | 2.4 | 3.3 | 4.5 | 6.2 | 8.5 | 11.7 |
| Revenue Growth, % | 0 | 66.92 | 1532.58 | -5.6 | -12.21 | 37.28 | 37.28 | 37.28 | 37.28 | 37.28 |
| EBITDA | .0 | -3.3 | -4.1 | -9.8 | -13.3 | -2.4 | -3.2 | -4.5 | -6.1 | -8.4 |
| EBITDA, % | 41.42 | -1855.64 | -139.99 | -359.1 | -552.46 | -71.72 | -71.72 | -71.72 | -71.72 | -71.72 |
| Depreciation | 3.8 | .0 | .3 | .5 | .3 | 1.0 | 1.4 | 1.9 | 2.6 | 3.5 |
| Depreciation, % | 3545.49 | 9.64 | 10.87 | 16.51 | 13.77 | 30.16 | 30.16 | 30.16 | 30.16 | 30.16 |
| EBIT | -3.7 | -3.3 | -4.4 | -10.3 | -13.6 | -3.3 | -4.5 | -6.2 | -8.5 | -11.7 |
| EBIT, % | -3504.07 | -1865.28 | -150.86 | -375.61 | -566.24 | -100 | -100 | -100 | -100 | -100 |
| Total Cash | .0 | .0 | 24.8 | 24.9 | 14.7 | 2.2 | 3.0 | 4.1 | 5.6 | 7.6 |
| Total Cash, percent | .0 | .0 | .0 | .0 | .0 | .0 | .0 | .0 | .0 | .0 |
| Account Receivables | .4 | .0 | 1.4 | 2.8 | .1 | 1.8 | 2.5 | 3.4 | 4.7 | 6.4 |
| Account Receivables, % | 350.14 | 21.79 | 47.37 | 102.92 | 5.64 | 54.96 | 54.96 | 54.96 | 54.96 | 54.96 |
| Inventories | .0 | .0 | .0 | .0 | .0 | .0 | .0 | .0 | .0 | .0 |
| Inventories, % | 5.68E-14 | 0 | 0 | 0 | 0 | 1.11E-14 | 1.11E-14 | 1.11E-14 | 1.11E-14 | 1.11E-14 |
| Accounts Payable | 1.2 | 1.7 | 1.4 | 2.5 | 1.5 | 2.7 | 3.7 | 5.0 | 6.9 | 9.4 |
| Accounts Payable, % | 1153.2 | 930.41 | 49.75 | 91.46 | 61.99 | 80.64 | 80.64 | 80.64 | 80.64 | 80.64 |
| Capital Expenditure | .0 | -.1 | -1.3 | -1.2 | .0 | -1.0 | -1.3 | -1.8 | -2.5 | -3.5 |
| Capital Expenditure, % | 0 | -59.12 | -45.39 | -42.83 | -0.68856 | -29.6 | -29.6 | -29.6 | -29.6 | -29.6 |
| Tax Rate, % | 0 | 0 | 0 | 0 | 0 | 0 | 0 | 0 | 0 | 0 |
| EBITAT | -3.7 | -3.3 | -4.4 | -10.3 | -13.6 | -3.3 | -4.5 | -6.2 | -8.5 | -11.7 |
| Depreciation | ||||||||||
| Changes in Account Receivables | ||||||||||
| Changes in Inventories | ||||||||||
| Changes in Accounts Payable | ||||||||||
| Capital Expenditure | ||||||||||
| UFCF | .9 | -2.6 | -6.9 | -11.4 | -11.6 | -3.8 | -4.2 | -5.7 | -7.9 | -10.8 |
| WACC, % | 14.2 | 14.2 | 14.2 | 14.2 | 14.2 | 14.2 | 14.2 | 14.2 | 14.2 | 14.2 |
| PV UFCF | ||||||||||
| SUM PV UFCF | -20.6 | |||||||||
| Long Term Growth Rate, % | 2.00 | |||||||||
| Free cash flow (T + 1) | -11 | |||||||||
| Terminal Value | -91 | |||||||||
| Present Terminal Value | -47 | |||||||||
| Enterprise Value | -67 | |||||||||
| Net Debt | -15 | |||||||||
| Equity Value | -53 | |||||||||
| Diluted Shares Outstanding, MM | 14 | |||||||||
| Equity Value Per Share | -3.67 |
What You Will Receive
- Customizable Excel Template: A fully editable Excel-based DCF Calculator featuring pre-filled real KBNT financials.
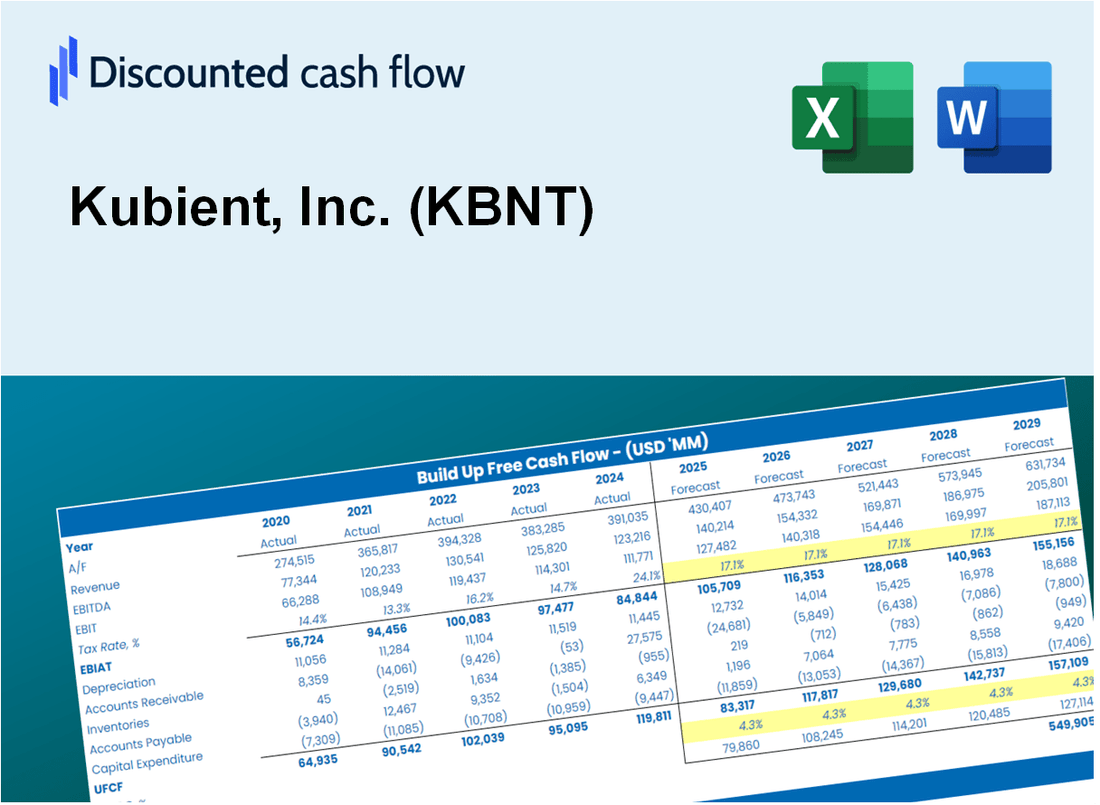
- Actual Data Insights: Access to historical data and forward-looking projections (highlighted in the yellow cells).
- Flexible Forecasting: Modify key assumptions such as revenue growth, EBITDA %, and WACC.
- Instant Calculations: Quickly observe how your inputs affect Kubient’s valuation.
- Professional Resource: Designed for investors, CFOs, consultants, and financial analysts.
- User-Friendly Layout: Organized for clarity and ease of navigation, complete with step-by-step guidance.
Key Features
- Customizable Forecast Inputs: Adjust essential metrics such as revenue growth, gross margin, and operational costs.
- Instant DCF Valuation: Quickly computes intrinsic value, NPV, and additional financial outputs.
- High-Precision Accuracy: Incorporates Kubient’s actual financial data for reliable valuation results.
- Seamless Scenario Analysis: Easily evaluate various assumptions and analyze different outcomes.
- Efficiency Booster: Avoid the hassle of constructing intricate valuation models from the ground up.
How It Works
- Step 1: Download the prebuilt Excel template featuring Kubient, Inc. (KBNT) data.
- Step 2: Review the pre-filled sheets to familiarize yourself with the essential metrics.
- Step 3: Modify forecasts and assumptions in the editable yellow cells (WACC, growth, margins).
- Step 4: Instantly see the recalculated results, including Kubient, Inc.'s (KBNT) intrinsic value.
- Step 5: Make well-informed investment decisions or create reports based on the outputs.
Why Choose This Calculator for Kubient, Inc. (KBNT)?
- Accurate Data: Utilize real Kubient financials to ensure trustworthy valuation outcomes.
- Customizable: Tailor key variables such as growth rates, WACC, and tax rates to align with your forecasts.
- Time-Saving: Pre-configured calculations save you from starting from the ground up.
- Professional-Grade Tool: Crafted for investors, analysts, and consultants in the field.
- User-Friendly: An intuitive interface and clear, step-by-step guidance make it accessible for everyone.
Who Should Use Kubient, Inc. (KBNT)?
- Investors: Gain insights into the digital advertising landscape with advanced analytics tools.
- Marketing Professionals: Streamline campaign strategies using Kubient's innovative platform.
- Data Analysts: Leverage robust data solutions for real-time performance tracking.
- Advertisers: Enhance targeting precision and maximize ROI through sophisticated ad technology.
- Educators and Students: Explore cutting-edge concepts in digital marketing and advertising technology.
What the Template Contains
- Pre-Filled DCF Model: Kubient, Inc.'s (KBNT) financial data preloaded for immediate use.
- WACC Calculator: Detailed calculations for Weighted Average Cost of Capital.
- Financial Ratios: Evaluate Kubient, Inc.'s (KBNT) profitability, leverage, and efficiency.
- Editable Inputs: Change assumptions such as growth, margins, and CAPEX to fit your scenarios.
- Financial Statements: Annual and quarterly reports to support detailed analysis.
- Interactive Dashboard: Easily visualize key valuation metrics and results.
Disclaimer
All information, articles, and product details provided on this website are for general informational and educational purposes only. We do not claim any ownership over, nor do we intend to infringe upon, any trademarks, copyrights, logos, brand names, or other intellectual property mentioned or depicted on this site. Such intellectual property remains the property of its respective owners, and any references here are made solely for identification or informational purposes, without implying any affiliation, endorsement, or partnership.
We make no representations or warranties, express or implied, regarding the accuracy, completeness, or suitability of any content or products presented. Nothing on this website should be construed as legal, tax, investment, financial, medical, or other professional advice. In addition, no part of this site—including articles or product references—constitutes a solicitation, recommendation, endorsement, advertisement, or offer to buy or sell any securities, franchises, or other financial instruments, particularly in jurisdictions where such activity would be unlawful.
All content is of a general nature and may not address the specific circumstances of any individual or entity. It is not a substitute for professional advice or services. Any actions you take based on the information provided here are strictly at your own risk. You accept full responsibility for any decisions or outcomes arising from your use of this website and agree to release us from any liability in connection with your use of, or reliance upon, the content or products found herein.