
|
كورن فيري (KFY) تقييم DCF |
Fully Editable: Tailor To Your Needs In Excel Or Sheets
Professional Design: Trusted, Industry-Standard Templates
Investor-Approved Valuation Models
MAC/PC Compatible, Fully Unlocked
No Expertise Is Needed; Easy To Follow
Korn Ferry (KFY) Bundle
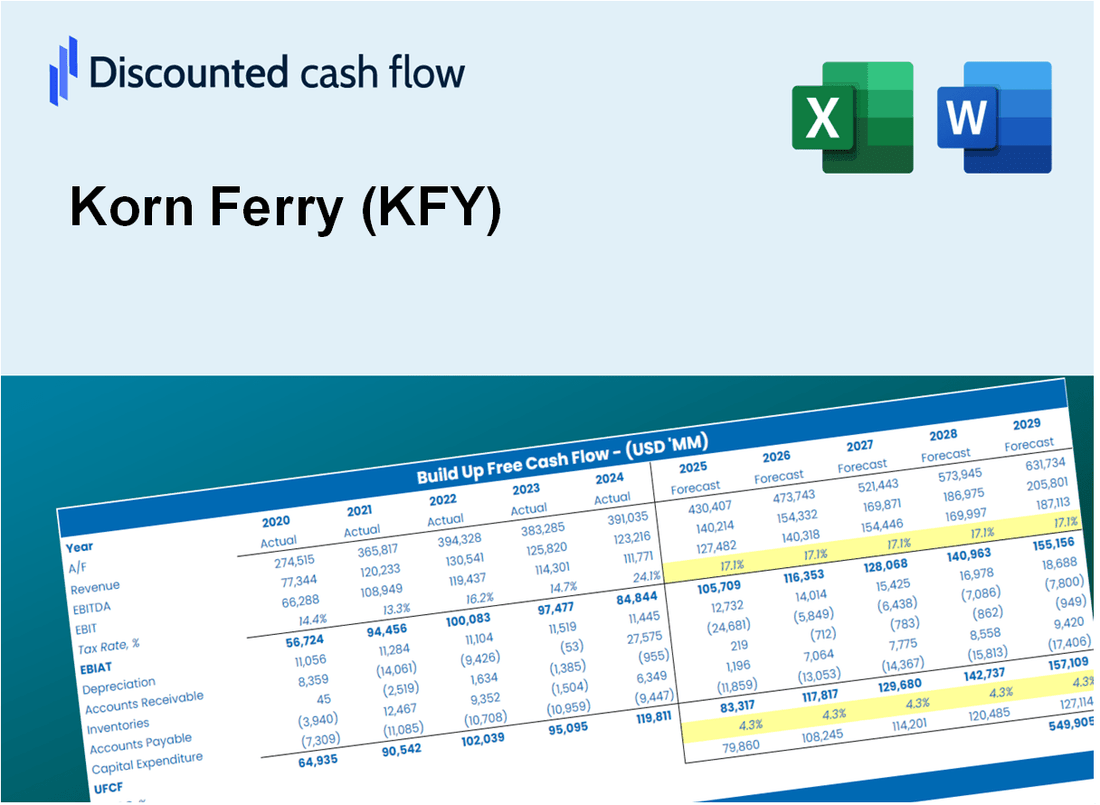
تم تصميم حاسبة DCF الخاصة بنا (KFY) (KFY) لدينا من تقييم تقييم Korn Ferry باستخدام البيانات المالية في العالم الحقيقي وتوفر مرونة كاملة لتعديل جميع المعلمات الأساسية للتوقعات المحسنة.
Discounted Cash Flow (DCF) - (USD MM)
| Year | AY1 2021 |
AY2 2022 |
AY3 2023 |
AY4 2024 |
AY5 2025 |
FY1 2026 |
FY2 2027 |
FY3 2028 |
FY4 2029 |
FY5 2030 |
|---|---|---|---|---|---|---|---|---|---|---|
| Revenue | 1,819.9 | 2,643.5 | 2,863.8 | 2,795.5 | 2,761.1 | 3,106.0 | 3,494.0 | 3,930.5 | 4,421.5 | 4,973.8 |
| Revenue Growth, % | 0 | 45.25 | 8.34 | -2.39 | -1.23 | 12.49 | 12.49 | 12.49 | 12.49 | 12.49 |
| EBITDA | 254.8 | 521.7 | 389.9 | 321.6 | 445.6 | 465.9 | 524.1 | 589.5 | 663.2 | 746.0 |
| EBITDA, % | 14 | 19.74 | 13.62 | 11.5 | 16.14 | 15 | 15 | 15 | 15 | 15 |
| Depreciation | 61.8 | 63.5 | 68.3 | 78.0 | 80.3 | 86.2 | 97.0 | 109.1 | 122.8 | 138.1 |
| Depreciation, % | 3.4 | 2.4 | 2.39 | 2.79 | 2.91 | 2.78 | 2.78 | 2.78 | 2.78 | 2.78 |
| EBIT | 193.0 | 458.2 | 321.6 | 243.6 | 365.3 | 379.6 | 427.0 | 480.4 | 540.4 | 607.9 |
| EBIT, % | 10.6 | 17.33 | 11.23 | 8.71 | 13.23 | 12.22 | 12.22 | 12.22 | 12.22 | 12.22 |
| Total Cash | 914.4 | 1,035.3 | 888.9 | 983.7 | 1,043.4 | 1,201.6 | 1,351.7 | 1,520.5 | 1,710.5 | 1,924.1 |
| Total Cash, percent | .0 | .0 | .0 | .0 | .0 | .0 | .0 | .0 | .0 | .0 |
| Account Receivables | 488.8 | 622.1 | 637.1 | 581.7 | 603.6 | 716.3 | 805.8 | 906.4 | 1,019.7 | 1,147.1 |
| Account Receivables, % | 26.86 | 23.54 | 22.25 | 20.81 | 21.86 | 23.06 | 23.06 | 23.06 | 23.06 | 23.06 |
| Inventories | .0 | .0 | .0 | .0 | .0 | .0 | .0 | .0 | .0 | .0 |
| Inventories, % | 0 | 0 | 0 | 0 | 0 | 0 | 0 | 0 | 0 | 0 |
| Accounts Payable | 45.0 | 50.9 | 53.4 | 50.1 | 58.9 | 63.3 | 71.2 | 80.1 | 90.1 | 101.4 |
| Accounts Payable, % | 2.47 | 1.93 | 1.86 | 1.79 | 2.13 | 2.04 | 2.04 | 2.04 | 2.04 | 2.04 |
| Capital Expenditure | -31.1 | -49.4 | -70.4 | -55.1 | -62.5 | -63.8 | -71.8 | -80.8 | -90.8 | -102.2 |
| Capital Expenditure, % | -1.71 | -1.87 | -2.46 | -1.97 | -2.26 | -2.05 | -2.05 | -2.05 | -2.05 | -2.05 |
| Tax Rate, % | 28.66 | 28.66 | 28.66 | 28.66 | 28.66 | 28.66 | 28.66 | 28.66 | 28.66 | 28.66 |
| EBITAT | 134.9 | 345.4 | 227.9 | 185.1 | 260.6 | 276.0 | 310.4 | 349.2 | 392.8 | 441.9 |
| Depreciation | ||||||||||
| Changes in Account Receivables | ||||||||||
| Changes in Inventories | ||||||||||
| Changes in Accounts Payable | ||||||||||
| Capital Expenditure | ||||||||||
| UFCF | -278.1 | 232.1 | 213.3 | 260.0 | 265.2 | 190.1 | 254.1 | 285.8 | 321.5 | 361.7 |
| WACC, % | 9.51 | 9.54 | 9.52 | 9.54 | 9.52 | 9.53 | 9.53 | 9.53 | 9.53 | 9.53 |
| PV UFCF | ||||||||||
| SUM PV UFCF | 1,055.9 | |||||||||
| Long Term Growth Rate, % | 2.00 | |||||||||
| Free cash flow (T + 1) | 369 | |||||||||
| Terminal Value | 4,903 | |||||||||
| Present Terminal Value | 3,111 | |||||||||
| Enterprise Value | 4,167 | |||||||||
| Net Debt | -436 | |||||||||
| Equity Value | 4,602 | |||||||||
| Diluted Shares Outstanding, MM | 53 | |||||||||
| Equity Value Per Share | 87.16 |
What You Will Get
- Authentic Korn Ferry Data: Comprehensive financials – encompassing revenue to EBIT – derived from actual and forecasted figures.
- Complete Customization: Modify all key variables (yellow cells) such as WACC, growth %, and tax rates.
- Real-Time Valuation Updates: Automatic recalculations to assess the effects of changes on Korn Ferry’s fair value.
- Flexible Excel Template: Designed for quick modifications, scenario analysis, and in-depth projections.
- Efficient and Precise: Avoid the hassle of building models from the ground up while ensuring accuracy and adaptability.
Key Features
- Comprehensive Talent Management Tools: Includes robust solutions for recruitment, development, and retention strategies.
- Market Insights and Analytics: Access to pre-built reports and customizable data analytics for informed decision-making.
- Customizable Assessment Frameworks: Tailor evaluation criteria and performance metrics to align with organizational goals.
- Integrated Leadership Development Programs: Enhance leadership skills with proven training and coaching methodologies.
- Visual Reporting Dashboards: Interactive charts and graphs provide a clear overview of talent metrics and trends.
How It Works
- 1. Access the Template: Download and open the Excel file containing Korn Ferry’s (KFY) preloaded data.
- 2. Modify Assumptions: Adjust critical inputs such as growth rates, WACC, and capital expenditures.
- 3. View Results Instantly: The DCF model automatically calculates intrinsic value and NPV.
- 4. Explore Scenarios: Analyze various forecasts to evaluate different valuation outcomes.
- 5. Present with Confidence: Deliver professional valuation insights to enhance your decision-making.
Why Choose This Tool for Korn Ferry (KFY)?
- Designed for Experts: A sophisticated resource utilized by HR professionals, executives, and consultants.
- Comprehensive Data: Korn Ferry’s historical and projected performance metrics are preloaded for precision.
- Flexible Scenario Analysis: Effortlessly simulate various forecasts and assumptions.
- Insightful Outputs: Automatically computes key performance indicators and strategic metrics.
- User-Friendly: Step-by-step guidance makes the process straightforward.
Who Should Use This Product?
- Investors: Accurately assess Korn Ferry’s (KFY) market position before making investment choices.
- CFOs: Utilize a comprehensive DCF model for financial analysis and reporting.
- Consultants: Easily customize the template for client valuation reports.
- Entrepreneurs: Obtain insights into the financial strategies employed by leading firms.
- Educators: Implement it as a resource to illustrate valuation techniques.
What the Korn Ferry Template Contains
- Preloaded KFY Data: Historical and projected financial data, including revenue, EBIT, and capital expenditures.
- DCF and WACC Models: Professional-grade sheets for calculating intrinsic value and Weighted Average Cost of Capital.
- Editable Inputs: Yellow-highlighted cells for adjusting revenue growth, tax rates, and discount rates.
- Financial Statements: Comprehensive annual and quarterly financials for deeper analysis.
- Key Ratios: Profitability, leverage, and efficiency ratios to evaluate performance.
- Dashboard and Charts: Visual summaries of valuation outcomes and assumptions.
Disclaimer
All information, articles, and product details provided on this website are for general informational and educational purposes only. We do not claim any ownership over, nor do we intend to infringe upon, any trademarks, copyrights, logos, brand names, or other intellectual property mentioned or depicted on this site. Such intellectual property remains the property of its respective owners, and any references here are made solely for identification or informational purposes, without implying any affiliation, endorsement, or partnership.
We make no representations or warranties, express or implied, regarding the accuracy, completeness, or suitability of any content or products presented. Nothing on this website should be construed as legal, tax, investment, financial, medical, or other professional advice. In addition, no part of this site—including articles or product references—constitutes a solicitation, recommendation, endorsement, advertisement, or offer to buy or sell any securities, franchises, or other financial instruments, particularly in jurisdictions where such activity would be unlawful.
All content is of a general nature and may not address the specific circumstances of any individual or entity. It is not a substitute for professional advice or services. Any actions you take based on the information provided here are strictly at your own risk. You accept full responsibility for any decisions or outcomes arising from your use of this website and agree to release us from any liability in connection with your use of, or reliance upon, the content or products found herein.