
|
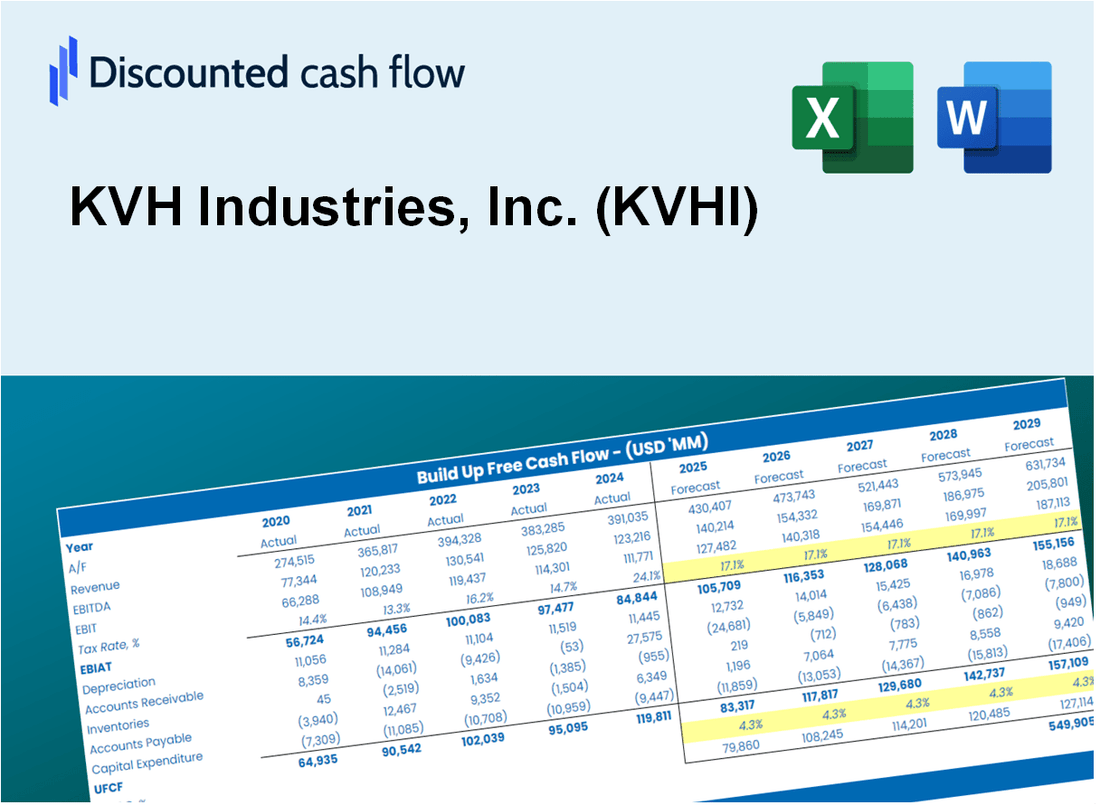
KVH Industries ، Inc. (KVHI) DCF تقييم |
Fully Editable: Tailor To Your Needs In Excel Or Sheets
Professional Design: Trusted, Industry-Standard Templates
Investor-Approved Valuation Models
MAC/PC Compatible, Fully Unlocked
No Expertise Is Needed; Easy To Follow
KVH Industries, Inc. (KVHI) Bundle
تبحث لتقييم القيمة الجوهرية لـ KVH Industries ، Inc.؟ يدمج حاسبة KVHI DCF الخاصة بنا بيانات العالم الحقيقي مع ميزات تخصيص واسعة ، مما يتيح لك تحسين توقعاتك وتعزيز استراتيجيات الاستثمار الخاصة بك.
What You Will Get
- Real KVHI Financials: Access to historical and projected data for precise valuation.
- Customizable Inputs: Adjust WACC, tax rates, revenue growth, and capital expenditures as needed.
- Dynamic Calculations: Intrinsic value and NPV are computed automatically.
- Scenario Analysis: Evaluate various scenarios to assess KVH Industries' future performance.
- User-Friendly Design: Crafted for professionals while remaining approachable for newcomers.
Key Features
- Comprehensive KVHI Data: Pre-filled with KVH Industries' historical financial performance and future projections.
- Fully Customizable Inputs: Tailor revenue growth, margins, WACC, tax rates, and capital expenditures to your needs.
- Dynamic Valuation Model: Automatic recalculations of Net Present Value (NPV) and intrinsic value based on user inputs.
- Scenario Testing: Develop various forecast scenarios to evaluate different valuation results.
- User-Friendly Interface: Intuitive, organized, and suitable for both professionals and novices.
How It Works
- Step 1: Download the prebuilt Excel template featuring KVH Industries, Inc. (KVHI) data.
- Step 2: Navigate through the pre-filled sheets to familiarize yourself with the essential metrics.
- Step 3: Modify forecasts and assumptions in the editable yellow cells (WACC, growth, margins).
- Step 4: Instantly see the updated results, including KVH Industries, Inc. (KVHI)'s intrinsic value.
- Step 5: Make well-informed investment decisions or create reports based on the outputs.
Why Choose This Calculator for KVH Industries, Inc. (KVHI)?
- Accurate Data: Up-to-date KVH financials provide dependable valuation outcomes.
- Customizable: Modify essential parameters such as growth rates, WACC, and tax rates to align with your forecasts.
- Time-Saving: Pre-configured calculations save you the effort of starting from the ground up.
- Professional-Grade Tool: Tailored for investors, analysts, and consultants in the industry.
- User-Friendly: Simple design and clear instructions ensure accessibility for all users.
Who Should Use This Product?
- Investors: Evaluate the fair value of KVH Industries, Inc. (KVHI) to inform your investment choices.
- CFOs: Utilize a robust DCF model for financial reporting and strategic analysis related to KVHI.
- Consultants: Easily customize the template for valuation reports tailored to KVH Industries' clients.
- Entrepreneurs: Acquire knowledge about financial modeling practices employed by leading companies like KVHI.
- Educators: Implement it as a resource to illustrate valuation techniques in the classroom.
What the Template Contains
- Comprehensive DCF Model: Editable template featuring detailed valuation calculations tailored for KVH Industries, Inc. (KVHI).
- Real-World Data: KVH Industries’ historical and projected financials preloaded for thorough analysis.
- Customizable Parameters: Adjust WACC, growth rates, and tax assumptions to explore various scenarios.
- Financial Statements: Complete annual and quarterly breakdowns for enhanced insights.
- Key Ratios: Integrated analysis for profitability, efficiency, and leverage metrics.
- Dashboard with Visual Outputs: Charts and tables designed for clear, actionable results specific to KVH Industries, Inc. (KVHI).
Disclaimer
All information, articles, and product details provided on this website are for general informational and educational purposes only. We do not claim any ownership over, nor do we intend to infringe upon, any trademarks, copyrights, logos, brand names, or other intellectual property mentioned or depicted on this site. Such intellectual property remains the property of its respective owners, and any references here are made solely for identification or informational purposes, without implying any affiliation, endorsement, or partnership.
We make no representations or warranties, express or implied, regarding the accuracy, completeness, or suitability of any content or products presented. Nothing on this website should be construed as legal, tax, investment, financial, medical, or other professional advice. In addition, no part of this site—including articles or product references—constitutes a solicitation, recommendation, endorsement, advertisement, or offer to buy or sell any securities, franchises, or other financial instruments, particularly in jurisdictions where such activity would be unlawful.
All content is of a general nature and may not address the specific circumstances of any individual or entity. It is not a substitute for professional advice or services. Any actions you take based on the information provided here are strictly at your own risk. You accept full responsibility for any decisions or outcomes arising from your use of this website and agree to release us from any liability in connection with your use of, or reliance upon, the content or products found herein.