
|
Lincoln Electric Holdings ، Inc. (LECO) DCF تقييم |
Fully Editable: Tailor To Your Needs In Excel Or Sheets
Professional Design: Trusted, Industry-Standard Templates
Investor-Approved Valuation Models
MAC/PC Compatible, Fully Unlocked
No Expertise Is Needed; Easy To Follow
Lincoln Electric Holdings, Inc. (LECO) Bundle
استكشف المستقبل المالي لـ Lincoln Electric Holdings ، Inc. (LECO) مع حاسبة DCF سهلة الاستخدام! أدخل افتراضاتك المتعلقة بالنمو والهوامش والتكاليف لحساب القيمة الجوهرية لـ Lincoln Electric Holdings ، Inc. (LECO) وتعزيز استراتيجية الاستثمار الخاصة بك.
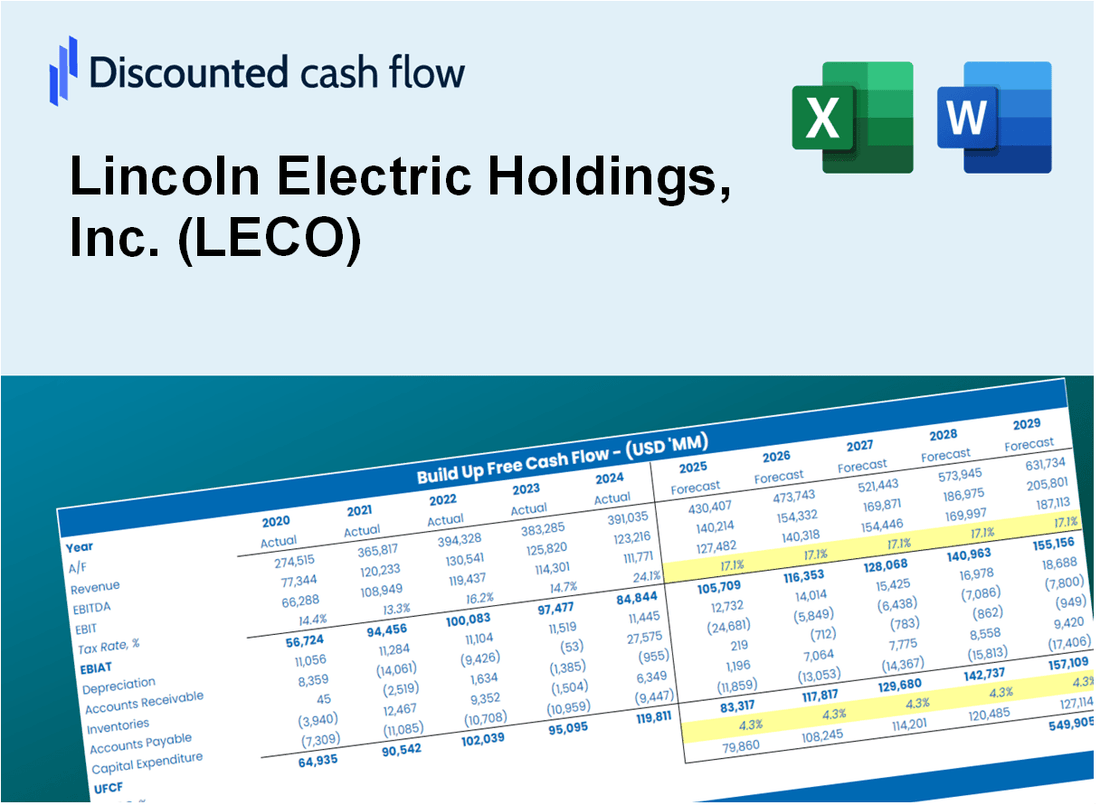
Discounted Cash Flow (DCF) - (USD MM)
| Year | AY1 2020 |
AY2 2021 |
AY3 2022 |
AY4 2023 |
AY5 2024 |
FY1 2025 |
FY2 2026 |
FY3 2027 |
FY4 2028 |
FY5 2029 |
|---|---|---|---|---|---|---|---|---|---|---|
| Revenue | 2,655.4 | 3,234.2 | 3,761.2 | 4,191.6 | 4,008.7 | 4,461.4 | 4,965.2 | 5,525.9 | 6,149.9 | 6,844.4 |
| Revenue Growth, % | 0 | 21.8 | 16.3 | 11.44 | -4.37 | 11.29 | 11.29 | 11.29 | 11.29 | 11.29 |
| EBITDA | 410.3 | 675.2 | 708.1 | 789.5 | 800.5 | 838.4 | 933.1 | 1,038.4 | 1,155.7 | 1,286.2 |
| EBITDA, % | 15.45 | 20.88 | 18.83 | 18.83 | 19.97 | 18.79 | 18.79 | 18.79 | 18.79 | 18.79 |
| Depreciation | 80.5 | 81.1 | 78.1 | 86.7 | 88.2 | 106.0 | 118.0 | 131.3 | 146.2 | 162.7 |
| Depreciation, % | 3.03 | 2.51 | 2.08 | 2.07 | 2.2 | 2.38 | 2.38 | 2.38 | 2.38 | 2.38 |
| EBIT | 329.9 | 594.1 | 630.1 | 702.8 | 712.3 | 732.4 | 815.1 | 907.1 | 1,009.5 | 1,123.5 |
| EBIT, % | 12.42 | 18.37 | 16.75 | 16.77 | 17.77 | 16.42 | 16.42 | 16.42 | 16.42 | 16.42 |
| Total Cash | 257.3 | 193.0 | 197.2 | 393.8 | 377.3 | 354.3 | 394.3 | 438.8 | 488.3 | 543.5 |
| Total Cash, percent | .0 | .0 | .0 | .0 | .0 | .0 | .0 | .0 | .0 | .0 |
| Account Receivables | 373.5 | 429.1 | 541.5 | 580.6 | 482.0 | 603.2 | 671.3 | 747.2 | 831.5 | 925.4 |
| Account Receivables, % | 14.07 | 13.27 | 14.4 | 13.85 | 12.02 | 13.52 | 13.52 | 13.52 | 13.52 | 13.52 |
| Inventories | 381.3 | 539.9 | 665.5 | 562.9 | 544.0 | 675.8 | 752.2 | 837.1 | 931.6 | 1,036.8 |
| Inventories, % | 14.36 | 16.69 | 17.69 | 13.43 | 13.57 | 15.15 | 15.15 | 15.15 | 15.15 | 15.15 |
| Accounts Payable | 226.1 | 330.2 | 352.1 | 325.4 | 296.6 | 385.9 | 429.5 | 478.0 | 532.0 | 592.0 |
| Accounts Payable, % | 8.52 | 10.21 | 9.36 | 7.76 | 7.4 | 8.65 | 8.65 | 8.65 | 8.65 | 8.65 |
| Capital Expenditure | -59.2 | -62.5 | -71.9 | -91.0 | -116.6 | -99.5 | -110.8 | -123.3 | -137.2 | -152.7 |
| Capital Expenditure, % | -2.23 | -1.93 | -1.91 | -2.17 | -2.91 | -2.23 | -2.23 | -2.23 | -2.23 | -2.23 |
| Tax Rate, % | 21.55 | 21.55 | 21.55 | 21.55 | 21.55 | 21.55 | 21.55 | 21.55 | 21.55 | 21.55 |
| EBITAT | 257.5 | 505.6 | 501.9 | 557.9 | 558.8 | 586.8 | 653.1 | 726.9 | 808.9 | 900.3 |
| Depreciation | ||||||||||
| Changes in Account Receivables | ||||||||||
| Changes in Inventories | ||||||||||
| Changes in Accounts Payable | ||||||||||
| Capital Expenditure | ||||||||||
| UFCF | -249.9 | 414.1 | 291.9 | 590.4 | 619.1 | 429.6 | 559.5 | 622.7 | 693.0 | 771.3 |
| WACC, % | 9.06 | 9.08 | 9.06 | 9.06 | 9.06 | 9.06 | 9.06 | 9.06 | 9.06 | 9.06 |
| PV UFCF | ||||||||||
| SUM PV UFCF | 2,333.8 | |||||||||
| Long Term Growth Rate, % | 3.00 | |||||||||
| Free cash flow (T + 1) | 794 | |||||||||
| Terminal Value | 13,099 | |||||||||
| Present Terminal Value | 8,488 | |||||||||
| Enterprise Value | 10,822 | |||||||||
| Net Debt | 939 | |||||||||
| Equity Value | 9,883 | |||||||||
| Diluted Shares Outstanding, MM | 57 | |||||||||
| Equity Value Per Share | 172.80 |
What You Will Get
- Real LECO Financial Data: Pre-filled with Lincoln Electric’s historical and projected data for precise analysis.
- Fully Editable Template: Modify key inputs like revenue growth, WACC, and EBITDA % with ease.
- Automatic Calculations: See Lincoln Electric’s intrinsic value update instantly based on your changes.
- Professional Valuation Tool: Designed for investors, analysts, and consultants seeking accurate DCF results.
- User-Friendly Design: Simple structure and clear instructions for all experience levels.
Key Features
- 🔍 Real-Life LECO Financials: Pre-filled historical and projected data for Lincoln Electric Holdings, Inc. (LECO).
- ✏️ Fully Customizable Inputs: Adjust all critical parameters (yellow cells) like WACC, growth %, and tax rates.
- 📊 Professional DCF Valuation: Built-in formulas calculate Lincoln Electric’s intrinsic value using the Discounted Cash Flow method.
- ⚡ Instant Results: Visualize Lincoln Electric’s valuation instantly after making changes.
- Scenario Analysis: Test and compare outcomes for various financial assumptions side-by-side.
How It Works
- Download: Obtain the pre-built Excel file featuring Lincoln Electric Holdings, Inc.'s (LECO) financial data.
- Customize: Modify forecasts, such as revenue growth, EBITDA %, and WACC according to your analysis.
- Update Automatically: The intrinsic value and NPV calculations refresh in real-time as you make changes.
- Test Scenarios: Develop various projections and instantly compare the results.
- Make Decisions: Leverage the valuation outcomes to inform your investment strategy.
Why Choose This Calculator for Lincoln Electric Holdings, Inc. (LECO)?
- Accuracy: Utilizes real financial data from Lincoln Electric for precise calculations.
- Flexibility: Allows users to easily adjust and experiment with various inputs.
- Time-Saving: Eliminates the need to create a DCF model from the ground up.
- Professional-Grade: Crafted with the expertise and standards expected by CFOs.
- User-Friendly: Intuitive interface makes it accessible for users with any level of financial knowledge.
Who Should Use This Product?
- Individual Investors: Gain insights to make informed decisions about buying or selling Lincoln Electric Holdings, Inc. (LECO) stock.
- Financial Analysts: Enhance valuation processes with comprehensive financial models tailored for Lincoln Electric Holdings, Inc. (LECO).
- Consultants: Provide clients with accurate and timely valuation insights related to Lincoln Electric Holdings, Inc. (LECO).
- Business Owners: Learn how major players like Lincoln Electric Holdings, Inc. (LECO) are valued to inform your own business strategies.
- Finance Students: Explore valuation techniques using real-world data and case studies from Lincoln Electric Holdings, Inc. (LECO).
What the Template Contains
- Pre-Filled Data: Includes Lincoln Electric Holdings, Inc.'s (LECO) historical financials and forecasts.
- Discounted Cash Flow Model: Editable DCF valuation model with automatic calculations.
- Weighted Average Cost of Capital (WACC): A dedicated sheet for calculating WACC based on custom inputs.
- Key Financial Ratios: Analyze Lincoln Electric Holdings, Inc.'s (LECO) profitability, efficiency, and leverage.
- Customizable Inputs: Edit revenue growth, margins, and tax rates with ease.
- Clear Dashboard: Charts and tables summarizing key valuation results.
Disclaimer
All information, articles, and product details provided on this website are for general informational and educational purposes only. We do not claim any ownership over, nor do we intend to infringe upon, any trademarks, copyrights, logos, brand names, or other intellectual property mentioned or depicted on this site. Such intellectual property remains the property of its respective owners, and any references here are made solely for identification or informational purposes, without implying any affiliation, endorsement, or partnership.
We make no representations or warranties, express or implied, regarding the accuracy, completeness, or suitability of any content or products presented. Nothing on this website should be construed as legal, tax, investment, financial, medical, or other professional advice. In addition, no part of this site—including articles or product references—constitutes a solicitation, recommendation, endorsement, advertisement, or offer to buy or sell any securities, franchises, or other financial instruments, particularly in jurisdictions where such activity would be unlawful.
All content is of a general nature and may not address the specific circumstances of any individual or entity. It is not a substitute for professional advice or services. Any actions you take based on the information provided here are strictly at your own risk. You accept full responsibility for any decisions or outcomes arising from your use of this website and agree to release us from any liability in connection with your use of, or reliance upon, the content or products found herein.