
|
Legend Biotech Corporation (LEGN) DCF تقييم |
Fully Editable: Tailor To Your Needs In Excel Or Sheets
Professional Design: Trusted, Industry-Standard Templates
Investor-Approved Valuation Models
MAC/PC Compatible, Fully Unlocked
No Expertise Is Needed; Easy To Follow
Legend Biotech Corporation (LEGN) Bundle
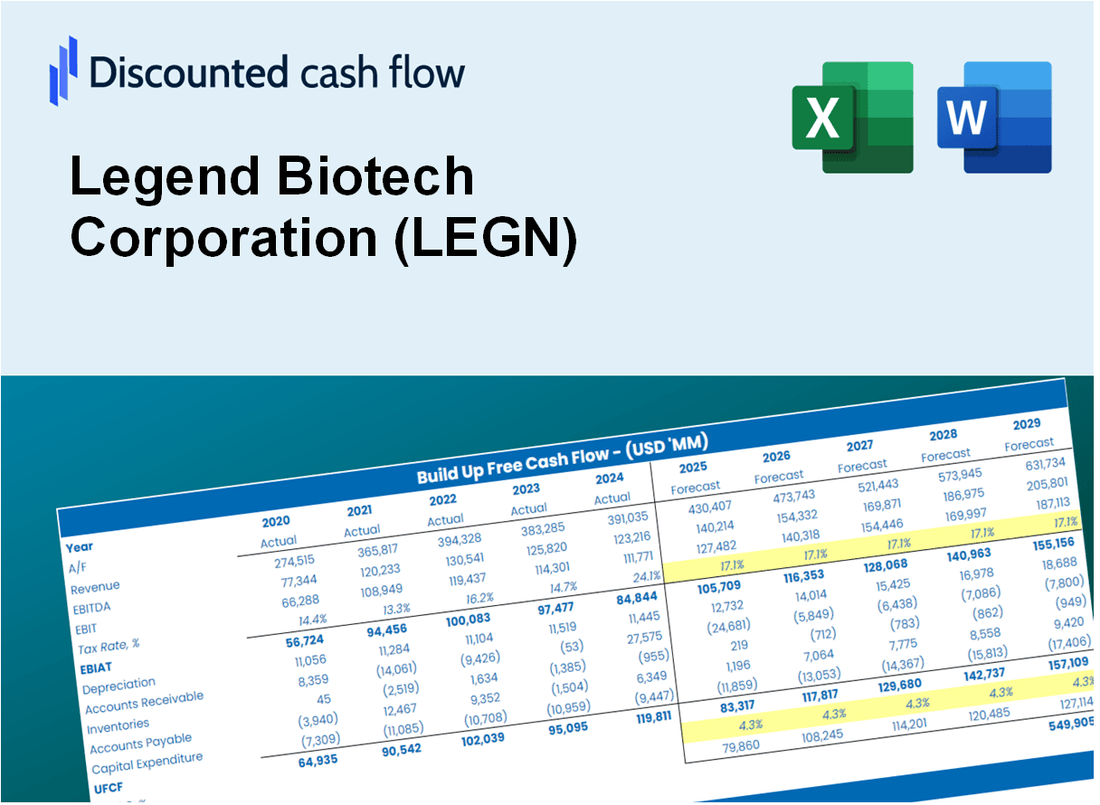
عزز استراتيجيات الاستثمار الخاصة بك مع حاسبة شركة الأسطورة Biotech Corporation (LEGN) DCF! الاستفادة من البيانات المالية الأصيلة من Legend Biotech ، وضبط توقعات النمو والنفقات ، ولاحظ على الفور كيفية تأثير هذه التعديلات على القيمة الجوهرية لـ (LEGN).
What You Will Get
- Editable Forecast Inputs: Easily modify key assumptions (growth %, margins, WACC) to explore various scenarios.
- Real-World Data: Legend Biotech Corporation's (LEGN) financial data pre-loaded to facilitate your analysis.
- Automatic DCF Outputs: The template computes Net Present Value (NPV) and intrinsic value automatically.
- Customizable and Professional: A refined Excel model designed to meet your valuation requirements.
- Built for Analysts and Investors: Perfect for evaluating projections, confirming strategies, and enhancing efficiency.
Key Features
- Comprehensive Data: Legend Biotech's historical financial statements and pre-filled projections.
- Customizable Parameters: Adjust WACC, tax rates, revenue growth, and EBITDA margins as needed.
- Real-Time Insights: View Legend Biotech's intrinsic value update instantly.
- Visual Analytics: Dashboard graphs showcase valuation results and essential metrics.
- Designed for Precision: A professional-grade tool for analysts, investors, and finance professionals.
How It Works
- Download the Template: Gain immediate access to the Excel-based LEGN DCF Calculator.
- Input Your Assumptions: Modify the yellow-highlighted cells for growth rates, WACC, margins, and more.
- Instant Calculations: The model automatically calculates Legend Biotech’s intrinsic value.
- Test Scenarios: Experiment with different assumptions to assess potential valuation variations.
- Analyze and Decide: Utilize the results to inform your investment or financial analysis.
Why Choose This Calculator?
- Accurate Data: Real Legend Biotech financials ensure reliable valuation results.
- Customizable: Adjust key parameters like growth rates, WACC, and tax rates to match your projections.
- Time-Saving: Pre-built calculations eliminate the need to start from scratch.
- Professional-Grade Tool: Designed for investors, analysts, and consultants.
- User-Friendly: Intuitive layout and step-by-step instructions make it easy for all users.
Who Should Use This Product?
- Investors: Gain insights and make informed decisions with a cutting-edge analysis tool tailored for biotechnology.
- Financial Analysts: Streamline your workflow with a customizable financial model specifically designed for the biotech sector.
- Consultants: Effortlessly modify the template for client reports or presentations focused on biotech investments.
- Biotech Enthusiasts: Enhance your knowledge of biotech valuation methods through practical, real-world applications.
- Educators and Students: Utilize it as an effective resource for teaching and learning in biotech finance courses.
What the Template Contains
- Pre-Filled DCF Model: Legend Biotech Corporation’s (LEGN) financial data preloaded for immediate use.
- WACC Calculator: Detailed calculations for Weighted Average Cost of Capital.
- Financial Ratios: Evaluate Legend Biotech Corporation’s (LEGN) profitability, leverage, and efficiency.
- Editable Inputs: Change assumptions such as growth, margins, and CAPEX to fit your scenarios.
- Financial Statements: Annual and quarterly reports to support detailed analysis.
- Interactive Dashboard: Easily visualize key valuation metrics and results.
Disclaimer
All information, articles, and product details provided on this website are for general informational and educational purposes only. We do not claim any ownership over, nor do we intend to infringe upon, any trademarks, copyrights, logos, brand names, or other intellectual property mentioned or depicted on this site. Such intellectual property remains the property of its respective owners, and any references here are made solely for identification or informational purposes, without implying any affiliation, endorsement, or partnership.
We make no representations or warranties, express or implied, regarding the accuracy, completeness, or suitability of any content or products presented. Nothing on this website should be construed as legal, tax, investment, financial, medical, or other professional advice. In addition, no part of this site—including articles or product references—constitutes a solicitation, recommendation, endorsement, advertisement, or offer to buy or sell any securities, franchises, or other financial instruments, particularly in jurisdictions where such activity would be unlawful.
All content is of a general nature and may not address the specific circumstances of any individual or entity. It is not a substitute for professional advice or services. Any actions you take based on the information provided here are strictly at your own risk. You accept full responsibility for any decisions or outcomes arising from your use of this website and agree to release us from any liability in connection with your use of, or reliance upon, the content or products found herein.