|
Ligand Pharmaceuticals Incorporated (LGND) DCF تقييم |
Fully Editable: Tailor To Your Needs In Excel Or Sheets
Professional Design: Trusted, Industry-Standard Templates
Investor-Approved Valuation Models
MAC/PC Compatible, Fully Unlocked
No Expertise Is Needed; Easy To Follow
Ligand Pharmaceuticals Incorporated (LGND) Bundle
عزز خيارات الاستثمار الخاصة بك مع حاسبة (LGND) DCF! الاستفادة من البيانات المالية الفعلية لبيانات الأدوية ، وضبط توقعات النمو والنفقات ، ومراقبة على الفور كيف تؤثر هذه التعديلات على القيمة الجوهرية لـ (LGND).
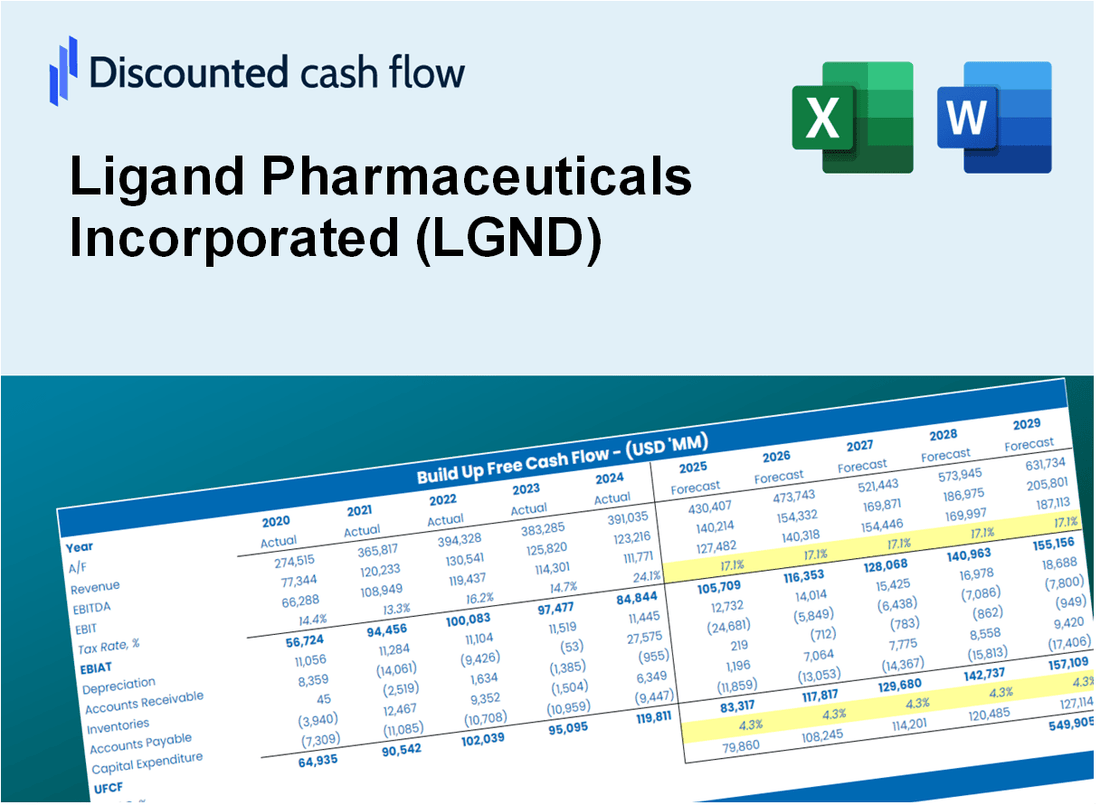
Discounted Cash Flow (DCF) - (USD MM)
| Year | AY1 2020 |
AY2 2021 |
AY3 2022 |
AY4 2023 |
AY5 2024 |
FY1 2025 |
FY2 2026 |
FY3 2027 |
FY4 2028 |
FY5 2029 |
|---|---|---|---|---|---|---|---|---|---|---|
| Revenue | 163.6 | 241.5 | 196.2 | 131.3 | 167.1 | 176.8 | 187.0 | 197.8 | 209.2 | 221.3 |
| Revenue Growth, % | 0 | 47.68 | -18.75 | -33.09 | 27.28 | 5.78 | 5.78 | 5.78 | 5.78 | 5.78 |
| EBITDA | 56.7 | 142.8 | 81.2 | 100.8 | 40.8 | 83.6 | 88.4 | 93.5 | 98.9 | 104.6 |
| EBITDA, % | 34.65 | 59.11 | 41.38 | 76.79 | 24.41 | 47.27 | 47.27 | 47.27 | 47.27 | 47.27 |
| Depreciation | 28.0 | 50.9 | 43.4 | 36.5 | 35.2 | 38.6 | 40.8 | 43.2 | 45.7 | 48.3 |
| Depreciation, % | 17.1 | 21.09 | 22.11 | 27.81 | 21.08 | 21.84 | 21.84 | 21.84 | 21.84 | 21.84 |
| EBIT | 28.7 | 91.8 | 37.8 | 64.3 | 5.6 | 45.0 | 47.6 | 50.3 | 53.2 | 56.3 |
| EBIT, % | 17.55 | 38.02 | 19.27 | 48.98 | 3.32 | 25.43 | 25.43 | 25.43 | 25.43 | 25.43 |
| Total Cash | 411.2 | 341.1 | 211.9 | 170.3 | 256.2 | 176.8 | 187.0 | 197.8 | 209.2 | 221.3 |
| Total Cash, percent | .0 | .0 | .0 | .0 | .0 | .0 | .0 | .0 | .0 | .0 |
| Account Receivables | 59.1 | 91.6 | 35.0 | 39.3 | 42.4 | 52.1 | 55.1 | 58.3 | 61.6 | 65.2 |
| Account Receivables, % | 36.11 | 37.94 | 17.85 | 29.94 | 25.4 | 29.45 | 29.45 | 29.45 | 29.45 | 29.45 |
| Inventories | 26.5 | 27.3 | 13.3 | 24.0 | 14.1 | 21.6 | 22.8 | 24.1 | 25.5 | 27.0 |
| Inventories, % | 16.19 | 11.31 | 6.77 | 18.25 | 8.44 | 12.2 | 12.2 | 12.2 | 12.2 | 12.2 |
| Accounts Payable | 3.8 | 8.4 | 5.3 | 2.4 | 5.2 | 4.8 | 5.0 | 5.3 | 5.6 | 6.0 |
| Accounts Payable, % | 2.31 | 3.48 | 2.7 | 1.85 | 3.13 | 2.7 | 2.7 | 2.7 | 2.7 | 2.7 |
| Capital Expenditure | -4.5 | -8.8 | -17.9 | -53.8 | -19.6 | -24.1 | -25.5 | -27.0 | -28.6 | -30.2 |
| Capital Expenditure, % | -2.73 | -3.63 | -9.13 | -41.01 | -11.75 | -13.65 | -13.65 | -13.65 | -13.65 | -13.65 |
| Tax Rate, % | 260.13 | 260.13 | 260.13 | 260.13 | 260.13 | 260.13 | 260.13 | 260.13 | 260.13 | 260.13 |
| EBITAT | -66.3 | 72.7 | -35.0 | 52.7 | -8.9 | 14.5 | 15.3 | 16.2 | 17.1 | 18.1 |
| Depreciation | ||||||||||
| Changes in Account Receivables | ||||||||||
| Changes in Inventories | ||||||||||
| Changes in Accounts Payable | ||||||||||
| Capital Expenditure | ||||||||||
| UFCF | -124.6 | 86.0 | 58.0 | 17.5 | 16.2 | 11.4 | 26.7 | 28.2 | 29.8 | 31.5 |
| WACC, % | 7.79 | 7.85 | 7.79 | 7.86 | 7.79 | 7.82 | 7.82 | 7.82 | 7.82 | 7.82 |
| PV UFCF | ||||||||||
| SUM PV UFCF | 99.8 | |||||||||
| Long Term Growth Rate, % | 2.00 | |||||||||
| Free cash flow (T + 1) | 32 | |||||||||
| Terminal Value | 553 | |||||||||
| Present Terminal Value | 380 | |||||||||
| Enterprise Value | 480 | |||||||||
| Net Debt | -65 | |||||||||
| Equity Value | 545 | |||||||||
| Diluted Shares Outstanding, MM | 18 | |||||||||
| Equity Value Per Share | 29.79 |
What You Will Receive
- Comprehensive Financial Model: Utilize Ligand Pharmaceuticals' (LGND) actual data for an accurate DCF valuation.
- Complete Forecasting Control: Modify revenue growth, profit margins, WACC, and other crucial parameters.
- Real-Time Calculations: Automatic updates provide immediate insights as you adjust inputs.
- Professional-Grade Template: An expertly crafted Excel file tailored for high-quality valuation.
- Flexible and Reusable: Designed for adaptability, allowing for repeated application in detailed forecasting.
Key Features
- 🔍 Real-Life LGND Financials: Pre-filled historical and projected data for Ligand Pharmaceuticals Incorporated.
- ✏️ Fully Customizable Inputs: Adjust all critical parameters (yellow cells) like WACC, growth %, and tax rates.
- 📊 Professional DCF Valuation: Built-in formulas calculate Ligand’s intrinsic value using the Discounted Cash Flow method.
- ⚡ Instant Results: Visualize Ligand’s valuation instantly after making changes.
- Scenario Analysis: Test and compare outcomes for various financial assumptions side-by-side.
How It Works
- Step 1: Download the Excel file.
- Step 2: Review Ligand Pharmaceuticals Incorporated’s pre-filled financial data and forecasts.
- Step 3: Modify key inputs such as revenue growth, WACC, and tax rates (highlighted cells).
- Step 4: Observe the DCF model update in real-time as you adjust your assumptions.
- Step 5: Analyze the outputs and utilize the results for your investment strategies.
Why Choose This Calculator?
- Designed for Experts: A sophisticated tool utilized by researchers, investors, and financial analysts.
- Comprehensive Data: Ligand Pharmaceuticals' (LGND) historical and projected financials included for precision.
- Flexible Scenario Analysis: Effortlessly test various forecasts and assumptions.
- Insightful Outputs: Automatically computes intrinsic value, NPV, and essential metrics.
- User-Friendly: Step-by-step guidance simplifies the entire process.
Who Should Use This Product?
- Professional Investors: Develop comprehensive and accurate valuation models for analyzing portfolios focused on Ligand Pharmaceuticals (LGND).
- Corporate Finance Teams: Evaluate valuation scenarios to inform strategic decisions within their organizations.
- Consultants and Advisors: Deliver precise valuation insights to clients interested in Ligand Pharmaceuticals (LGND).
- Students and Educators: Utilize real-world data to learn and teach financial modeling techniques related to the biotech sector.
- Biotech Enthusiasts: Gain insights into how companies like Ligand Pharmaceuticals (LGND) are valued in the investment landscape.
What the Template Contains
- Operating and Balance Sheet Data: Pre-filled Ligand Pharmaceuticals historical data and forecasts, including revenue, EBITDA, EBIT, and capital expenditures.
- WACC Calculation: A dedicated sheet for Weighted Average Cost of Capital (WACC), including parameters like Beta, risk-free rate, and share price.
- DCF Valuation (Unlevered and Levered): Editable Discounted Cash Flow models showing intrinsic value with detailed calculations.
- Financial Statements: Pre-loaded financial statements (annual and quarterly) to support analysis.
- Key Ratios: Includes profitability, leverage, and efficiency ratios for Ligand Pharmaceuticals (LGND).
- Dashboard and Charts: Visual summary of valuation outputs and assumptions to analyze results easily.
Disclaimer
All information, articles, and product details provided on this website are for general informational and educational purposes only. We do not claim any ownership over, nor do we intend to infringe upon, any trademarks, copyrights, logos, brand names, or other intellectual property mentioned or depicted on this site. Such intellectual property remains the property of its respective owners, and any references here are made solely for identification or informational purposes, without implying any affiliation, endorsement, or partnership.
We make no representations or warranties, express or implied, regarding the accuracy, completeness, or suitability of any content or products presented. Nothing on this website should be construed as legal, tax, investment, financial, medical, or other professional advice. In addition, no part of this site—including articles or product references—constitutes a solicitation, recommendation, endorsement, advertisement, or offer to buy or sell any securities, franchises, or other financial instruments, particularly in jurisdictions where such activity would be unlawful.
All content is of a general nature and may not address the specific circumstances of any individual or entity. It is not a substitute for professional advice or services. Any actions you take based on the information provided here are strictly at your own risk. You accept full responsibility for any decisions or outcomes arising from your use of this website and agree to release us from any liability in connection with your use of, or reliance upon, the content or products found herein.