
|
Aeye ، Inc. (LIDR) DCF تقييم |
Fully Editable: Tailor To Your Needs In Excel Or Sheets
Professional Design: Trusted, Industry-Standard Templates
Investor-Approved Valuation Models
MAC/PC Compatible, Fully Unlocked
No Expertise Is Needed; Easy To Follow
AEye, Inc. (LIDR) Bundle
هل تتطلع إلى تحديد القيمة الجوهرية لشركة Aeye ، Inc.؟ يدمج حاسبة LIDR DCF الخاصة بنا البيانات الواقعية مع ميزات تخصيص شاملة ، مما يتيح لك ضبط التوقعات وتعزيز استراتيجية الاستثمار الخاصة بك.
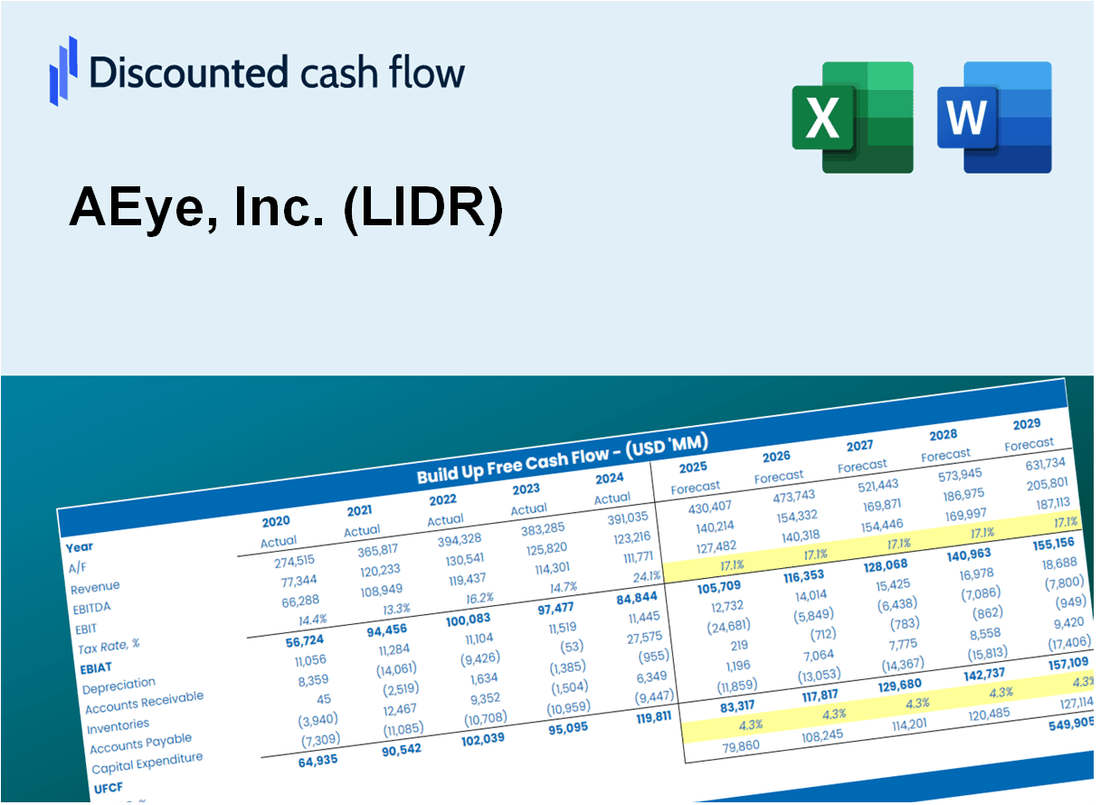
Discounted Cash Flow (DCF) - (USD MM)
| Year | AY1 2020 |
AY2 2021 |
AY3 2022 |
AY4 2023 |
AY5 2024 |
FY1 2025 |
FY2 2026 |
FY3 2027 |
FY4 2028 |
FY5 2029 |
|---|---|---|---|---|---|---|---|---|---|---|
| Revenue | 1.6 | 3.0 | 3.6 | 1.5 | .2 | .2 | .2 | .2 | .1 | .1 |
| Revenue Growth, % | 0 | 90.44 | 21.28 | -59.86 | -86.2 | -8.58 | -8.58 | -8.58 | -8.58 | -8.58 |
| EBITDA | -24.2 | -61.4 | -96.5 | -76.3 | -35.7 | -.2 | -.2 | -.2 | -.1 | -.1 |
| EBITDA, % | -1534.14 | -2043.5 | -2644.8 | -5210.11 | -17690.1 | -100 | -100 | -100 | -100 | -100 |
| Depreciation | .9 | 1.0 | 1.4 | 1.5 | .1 | .1 | .1 | .1 | .1 | .1 |
| Depreciation, % | 58.39 | 33.72 | 38.99 | 105.67 | 63.86 | 58.99 | 58.99 | 58.99 | 58.99 | 58.99 |
| EBIT | -25.1 | -62.5 | -97.9 | -77.8 | -35.9 | -.2 | -.2 | -.2 | -.1 | -.1 |
| EBIT, % | -1592.53 | -2077.22 | -2683.79 | -5315.78 | -17753.96 | -100 | -100 | -100 | -100 | -100 |
| Total Cash | 15.3 | 164.0 | 94.2 | 36.5 | 22.3 | .2 | .2 | .2 | .1 | .1 |
| Total Cash, percent | .0 | .0 | .0 | .0 | .0 | .0 | .0 | .0 | .0 | .0 |
| Account Receivables | .2 | 4.2 | .6 | .1 | 1.7 | .1 | .1 | .1 | .1 | .1 |
| Account Receivables, % | 9.88 | 140.41 | 16.92 | 8.95 | 836.63 | 47.15 | 47.15 | 47.15 | 47.15 | 47.15 |
| Inventories | 2.7 | 4.1 | 4.6 | .6 | .2 | .2 | .1 | .1 | .1 | .1 |
| Inventories, % | 168.14 | 135.85 | 124.84 | 39.82 | 87.13 | 85.39 | 85.39 | 85.39 | 85.39 | 85.39 |
| Accounts Payable | 1.8 | 2.5 | 3.2 | 3.4 | 3.6 | .2 | .2 | .1 | .1 | .1 |
| Accounts Payable, % | 114.44 | 84.54 | 88.24 | 235.11 | 1781.19 | 94.55 | 94.55 | 94.55 | 94.55 | 94.55 |
| Capital Expenditure | -4.0 | -1.0 | -4.2 | -2.0 | -.5 | -.2 | -.1 | -.1 | -.1 | -.1 |
| Capital Expenditure, % | -255.6 | -33.95 | -115.16 | -133.27 | -240.59 | -86.79 | -86.79 | -86.79 | -86.79 | -86.79 |
| Tax Rate, % | 0.00563984 | 0.00563984 | 0.00563984 | 0.00563984 | 0.00563984 | 0.00563984 | 0.00563984 | 0.00563984 | 0.00563984 | 0.00563984 |
| EBITAT | -25.1 | -62.5 | -97.9 | -77.9 | -35.9 | -.2 | -.2 | -.2 | -.1 | -.1 |
| Depreciation | ||||||||||
| Changes in Account Receivables | ||||||||||
| Changes in Inventories | ||||||||||
| Changes in Accounts Payable | ||||||||||
| Capital Expenditure | ||||||||||
| UFCF | -29.3 | -67.2 | -96.9 | -73.6 | -37.2 | -2.0 | -.2 | -.2 | -.2 | -.2 |
| WACC, % | 17.68 | 17.68 | 17.68 | 17.68 | 17.68 | 17.68 | 17.68 | 17.68 | 17.68 | 17.68 |
| PV UFCF | ||||||||||
| SUM PV UFCF | -2.2 | |||||||||
| Long Term Growth Rate, % | 2.00 | |||||||||
| Free cash flow (T + 1) | 0 | |||||||||
| Terminal Value | -1 | |||||||||
| Present Terminal Value | 0 | |||||||||
| Enterprise Value | -3 | |||||||||
| Net Debt | -6 | |||||||||
| Equity Value | 3 | |||||||||
| Diluted Shares Outstanding, MM | 7,942 | |||||||||
| Equity Value Per Share | 0.00 |
What You Will Get
- Editable Forecast Inputs: Easily modify assumptions (growth %, margins, WACC) to explore various scenarios.
- Real-World Data: AEye, Inc. (LIDR) financial data pre-filled to kickstart your analysis.
- Automatic DCF Outputs: The template computes Net Present Value (NPV) and intrinsic value for you.
- Customizable and Professional: A sleek Excel model that tailors to your valuation requirements.
- Built for Analysts and Investors: Perfect for evaluating projections, confirming strategies, and enhancing efficiency.
Key Features
- Real-Time LIDR Data: Pre-filled with AEye, Inc.'s historical performance metrics and future growth estimates.
- Customizable Parameters: Modify key inputs such as revenue projections, profit margins, discount rates, tax obligations, and capital investments.
- Interactive Valuation Model: Instant updates to Net Present Value (NPV) and intrinsic value reflecting your customized inputs.
- Scenario Analysis: Develop various forecasting scenarios to evaluate different potential valuation results.
- Intuitive Interface: Clean, organized layout designed for both industry experts and newcomers.
How It Works
- Step 1: Download the Excel file.
- Step 2: Review pre-entered AEye, Inc. (LIDR) data (historical and projected).
- Step 3: Adjust key assumptions (yellow cells) based on your analysis.
- Step 4: View automatic recalculations for AEye, Inc. (LIDR)’s intrinsic value.
- Step 5: Use the outputs for investment decisions or reporting.
Why Choose This Calculator for AEye, Inc. (LIDR)?
- Accurate Data: Access to real AEye financials guarantees trustworthy valuation results.
- Customizable: Tailor essential parameters like growth rates, WACC, and tax rates to align with your forecasts.
- Time-Saving: Built-in calculations save you from starting from scratch.
- Professional-Grade Tool: Crafted for investors, analysts, and consultants in the field.
- User-Friendly: Easy-to-navigate layout and clear instructions ensure accessibility for all users.
Who Should Use This Product?
- Investors: Evaluate AEye, Inc.'s (LIDR) market potential before making investment decisions.
- CFOs and Financial Analysts: Optimize valuation methodologies and assess future projections for AEye, Inc. (LIDR).
- Startup Founders: Understand the valuation strategies of innovative tech companies like AEye, Inc. (LIDR).
- Consultants: Provide detailed valuation analyses and reports for clients interested in AEye, Inc. (LIDR).
- Students and Educators: Utilize current data from AEye, Inc. (LIDR) to enhance learning on valuation practices.
What the Template Contains
- Pre-Filled Data: Contains AEye, Inc.'s historical financials and forecasts.
- Discounted Cash Flow Model: Editable DCF valuation model with automated calculations.
- Weighted Average Cost of Capital (WACC): A dedicated sheet for calculating WACC based on user-defined inputs.
- Key Financial Ratios: Evaluate AEye, Inc.'s profitability, efficiency, and leverage metrics.
- Customizable Inputs: Easily modify revenue growth, margins, and tax rates.
- Clear Dashboard: Visuals and tables summarizing essential valuation outcomes.
Disclaimer
All information, articles, and product details provided on this website are for general informational and educational purposes only. We do not claim any ownership over, nor do we intend to infringe upon, any trademarks, copyrights, logos, brand names, or other intellectual property mentioned or depicted on this site. Such intellectual property remains the property of its respective owners, and any references here are made solely for identification or informational purposes, without implying any affiliation, endorsement, or partnership.
We make no representations or warranties, express or implied, regarding the accuracy, completeness, or suitability of any content or products presented. Nothing on this website should be construed as legal, tax, investment, financial, medical, or other professional advice. In addition, no part of this site—including articles or product references—constitutes a solicitation, recommendation, endorsement, advertisement, or offer to buy or sell any securities, franchises, or other financial instruments, particularly in jurisdictions where such activity would be unlawful.
All content is of a general nature and may not address the specific circumstances of any individual or entity. It is not a substitute for professional advice or services. Any actions you take based on the information provided here are strictly at your own risk. You accept full responsibility for any decisions or outcomes arising from your use of this website and agree to release us from any liability in connection with your use of, or reliance upon, the content or products found herein.