
|
Louisiana-Pacific Corporation (LPX) DCF تقييم |
Fully Editable: Tailor To Your Needs In Excel Or Sheets
Professional Design: Trusted, Industry-Standard Templates
Investor-Approved Valuation Models
MAC/PC Compatible, Fully Unlocked
No Expertise Is Needed; Easy To Follow
Louisiana-Pacific Corporation (LPX) Bundle
تبحث لتقييم القيمة الجوهرية لشركة لويزيانا والمحيط الهادئ؟ يدمج حاسبة DCF الخاصة بنا (LPX) بيانات العالم الحقيقي ويوفر خيارات تخصيص شاملة ، مما يتيح لك تحسين توقعاتك وتعزيز استراتيجيات الاستثمار الخاصة بك.
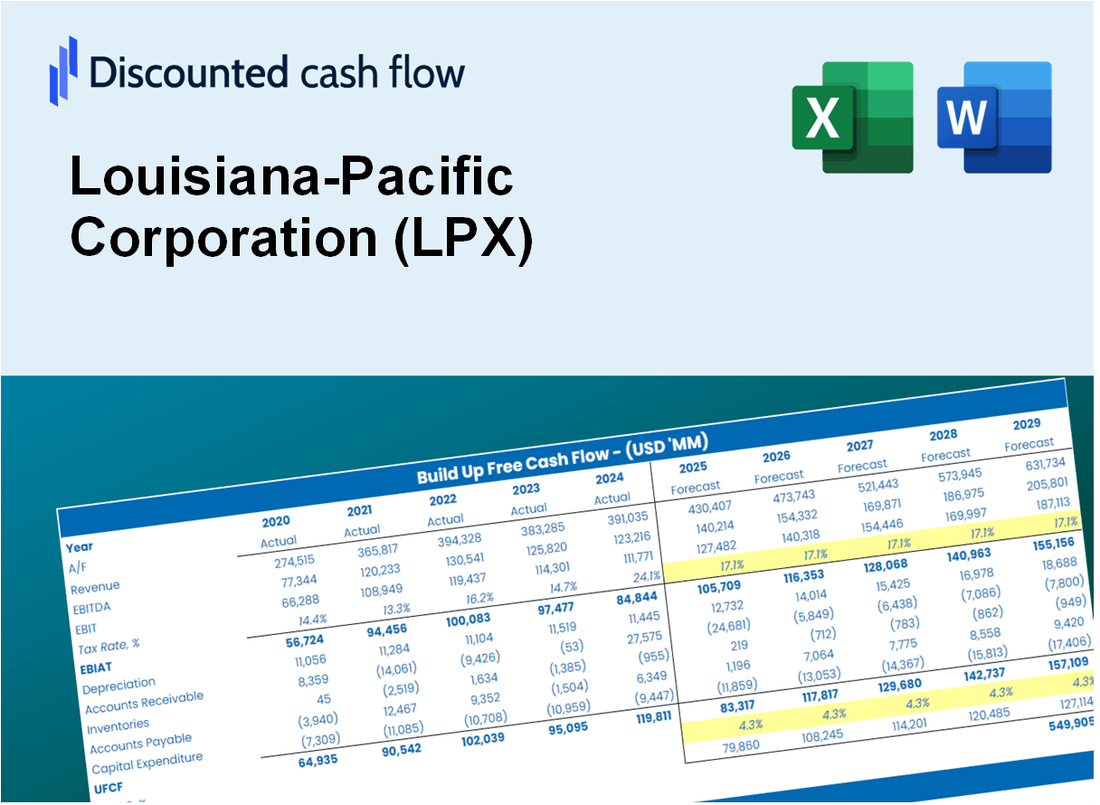
Discounted Cash Flow (DCF) - (USD MM)
| Year | AY1 2020 |
AY2 2021 |
AY3 2022 |
AY4 2023 |
AY5 2024 |
FY1 2025 |
FY2 2026 |
FY3 2027 |
FY4 2028 |
FY5 2029 |
|---|---|---|---|---|---|---|---|---|---|---|
| Revenue | 2,399.0 | 3,915.0 | 3,854.0 | 2,581.0 | 2,941.0 | 3,253.9 | 3,600.0 | 3,983.0 | 4,406.7 | 4,875.5 |
| Revenue Growth, % | 0 | 63.19 | -1.56 | -33.03 | 13.95 | 10.64 | 10.64 | 10.64 | 10.64 | 10.64 |
| EBITDA | 753.0 | 1,857.0 | 1,359.0 | 380.0 | 659.0 | 984.1 | 1,088.7 | 1,204.6 | 1,332.7 | 1,474.5 |
| EBITDA, % | 31.39 | 47.43 | 35.26 | 14.72 | 22.41 | 30.24 | 30.24 | 30.24 | 30.24 | 30.24 |
| Depreciation | 107.0 | 114.0 | 129.0 | 119.0 | 125.0 | 127.4 | 141.0 | 156.0 | 172.6 | 190.9 |
| Depreciation, % | 4.46 | 2.91 | 3.35 | 4.61 | 4.25 | 3.92 | 3.92 | 3.92 | 3.92 | 3.92 |
| EBIT | 646.0 | 1,743.0 | 1,230.0 | 261.0 | 534.0 | 856.6 | 947.8 | 1,048.6 | 1,160.1 | 1,283.6 |
| EBIT, % | 26.93 | 44.52 | 31.91 | 10.11 | 18.16 | 26.33 | 26.33 | 26.33 | 26.33 | 26.33 |
| Total Cash | 535.0 | 358.0 | 369.0 | 222.0 | 340.0 | 398.2 | 440.5 | 487.4 | 539.2 | 596.6 |
| Total Cash, percent | .0 | .0 | .0 | .0 | .0 | .0 | .0 | .0 | .0 | .0 |
| Account Receivables | 184.0 | 169.0 | 128.0 | 155.0 | 132.0 | 167.9 | 185.8 | 205.5 | 227.4 | 251.6 |
| Account Receivables, % | 7.67 | 4.32 | 3.32 | 6.01 | 4.49 | 5.16 | 5.16 | 5.16 | 5.16 | 5.16 |
| Inventories | 259.0 | 277.0 | 336.0 | 378.0 | 358.0 | 347.6 | 384.5 | 425.4 | 470.7 | 520.8 |
| Inventories, % | 10.8 | 7.08 | 8.72 | 14.65 | 12.17 | 10.68 | 10.68 | 10.68 | 10.68 | 10.68 |
| Accounts Payable | 125.0 | 180.0 | 178.0 | 141.0 | 139.0 | 160.2 | 177.2 | 196.1 | 217.0 | 240.0 |
| Accounts Payable, % | 5.21 | 4.6 | 4.62 | 5.46 | 4.73 | 4.92 | 4.92 | 4.92 | 4.92 | 4.92 |
| Capital Expenditure | -77.0 | -254.0 | -414.0 | -300.0 | -183.0 | -249.2 | -275.7 | -305.0 | -337.4 | -373.3 |
| Capital Expenditure, % | -3.21 | -6.49 | -10.74 | -11.62 | -6.22 | -7.66 | -7.66 | -7.66 | -7.66 | -7.66 |
| Tax Rate, % | 25 | 25 | 25 | 25 | 25 | 25 | 25 | 25 | 25 | 25 |
| EBITAT | 531.9 | 1,408.5 | 1,152.5 | 184.4 | 400.5 | 689.6 | 762.9 | 844.1 | 933.9 | 1,033.2 |
| Depreciation | ||||||||||
| Changes in Account Receivables | ||||||||||
| Changes in Inventories | ||||||||||
| Changes in Accounts Payable | ||||||||||
| Capital Expenditure | ||||||||||
| UFCF | 243.9 | 1,320.5 | 847.5 | -102.6 | 383.5 | 563.6 | 590.5 | 653.3 | 722.8 | 799.7 |
| WACC, % | 11.61 | 11.61 | 11.64 | 11.58 | 11.59 | 11.61 | 11.61 | 11.61 | 11.61 | 11.61 |
| PV UFCF | ||||||||||
| SUM PV UFCF | 2,376.5 | |||||||||
| Long Term Growth Rate, % | 0.50 | |||||||||
| Free cash flow (T + 1) | 804 | |||||||||
| Terminal Value | 7,236 | |||||||||
| Present Terminal Value | 4,178 | |||||||||
| Enterprise Value | 6,555 | |||||||||
| Net Debt | 40 | |||||||||
| Equity Value | 6,515 | |||||||||
| Diluted Shares Outstanding, MM | 71 | |||||||||
| Equity Value Per Share | 91.76 |
What You Will Receive
- Customizable Excel Template: A fully adjustable Excel-based DCF Calculator featuring pre-filled real LPX financials.
- Accurate Data: Historical insights and forward-looking projections (as indicated in the highlighted cells).
- Flexible Forecasting: Modify forecast assumptions such as revenue growth, EBITDA %, and WACC.
- Instant Calculations: Quickly observe how your inputs affect Louisiana-Pacific Corporation’s valuation.
- Professional Resource: Designed for investors, CFOs, consultants, and financial analysts.
- User-Friendly Layout: Organized for clarity and ease of navigation, complete with step-by-step guidance.
Key Features
- Comprehensive Financial Data: Gain access to reliable pre-loaded historical figures and future forecasts for Louisiana-Pacific Corporation (LPX).
- Adjustable Projection Variables: Modify highlighted cells for key metrics such as WACC, growth rates, and profit margins.
- Real-Time Calculations: Enjoy automatic updates to DCF, Net Present Value (NPV), and cash flow assessments.
- User-Friendly Dashboard: View clear charts and summaries to effectively visualize your valuation outcomes.
- Designed for All Skill Levels: An intuitive layout suitable for investors, CFOs, and consultants alike.
How It Works
- Download the Template: Gain immediate access to the Excel-based LPX DCF Calculator.
- Input Your Assumptions: Modify the yellow-highlighted cells for growth rates, WACC, margins, and other variables.
- Instant Calculations: The model automatically refreshes Louisiana-Pacific's intrinsic value.
- Test Scenarios: Experiment with various assumptions to assess potential valuation shifts.
- Analyze and Decide: Leverage the results to inform your investment or financial decisions.
Why Choose This Calculator for Louisiana-Pacific Corporation (LPX)?
- Accuracy: Reliable financial data from Louisiana-Pacific ensures precision.
- Flexibility: Tailored for users to experiment and adjust inputs effortlessly.
- Time-Saving: Eliminate the need to create a DCF model from the ground up.
- Professional-Grade: Crafted with the expertise and usability expected by CFOs.
- User-Friendly: Simple to navigate, even for those lacking advanced financial modeling skills.
Who Should Use This Product?
- Investors: Accurately estimate Louisiana-Pacific Corporation’s (LPX) fair value before making investment decisions.
- CFOs: Utilize a professional-grade DCF model for financial reporting and analysis specific to Louisiana-Pacific Corporation (LPX).
- Consultants: Rapidly customize the template for valuation reports tailored to Louisiana-Pacific Corporation (LPX) clients.
- Entrepreneurs: Acquire insights into financial modeling practices employed by leading companies like Louisiana-Pacific Corporation (LPX).
- Educators: Implement this tool as a teaching resource to illustrate valuation methodologies using Louisiana-Pacific Corporation (LPX) as a case study.
What the Template Contains
- Pre-Filled DCF Model: Louisiana-Pacific Corporation’s (LPX) financial data preloaded for immediate use.
- WACC Calculator: Detailed calculations for Weighted Average Cost of Capital.
- Financial Ratios: Evaluate Louisiana-Pacific Corporation’s (LPX) profitability, leverage, and efficiency.
- Editable Inputs: Change assumptions such as growth, margins, and CAPEX to fit your scenarios.
- Financial Statements: Annual and quarterly reports to support detailed analysis.
- Interactive Dashboard: Easily visualize key valuation metrics and results.
Disclaimer
All information, articles, and product details provided on this website are for general informational and educational purposes only. We do not claim any ownership over, nor do we intend to infringe upon, any trademarks, copyrights, logos, brand names, or other intellectual property mentioned or depicted on this site. Such intellectual property remains the property of its respective owners, and any references here are made solely for identification or informational purposes, without implying any affiliation, endorsement, or partnership.
We make no representations or warranties, express or implied, regarding the accuracy, completeness, or suitability of any content or products presented. Nothing on this website should be construed as legal, tax, investment, financial, medical, or other professional advice. In addition, no part of this site—including articles or product references—constitutes a solicitation, recommendation, endorsement, advertisement, or offer to buy or sell any securities, franchises, or other financial instruments, particularly in jurisdictions where such activity would be unlawful.
All content is of a general nature and may not address the specific circumstances of any individual or entity. It is not a substitute for professional advice or services. Any actions you take based on the information provided here are strictly at your own risk. You accept full responsibility for any decisions or outcomes arising from your use of this website and agree to release us from any liability in connection with your use of, or reliance upon, the content or products found herein.