
|
Larimar Therapeutics ، Inc. (LRMR) DCF تقييم |
Fully Editable: Tailor To Your Needs In Excel Or Sheets
Professional Design: Trusted, Industry-Standard Templates
Investor-Approved Valuation Models
MAC/PC Compatible, Fully Unlocked
No Expertise Is Needed; Easy To Follow
Larimar Therapeutics, Inc. (LRMR) Bundle
تم تصميم حاسبة DCF الخاصة بنا (LRMR) DCF الخاصة بنا ، بتقييم تقييم Larimar Therapeutics ، Inc. باستخدام البيانات المالية في العالم الحقيقي مع تقديم مرونة كاملة لتعديل جميع المعلمات الأساسية للتوقعات المحسنة.
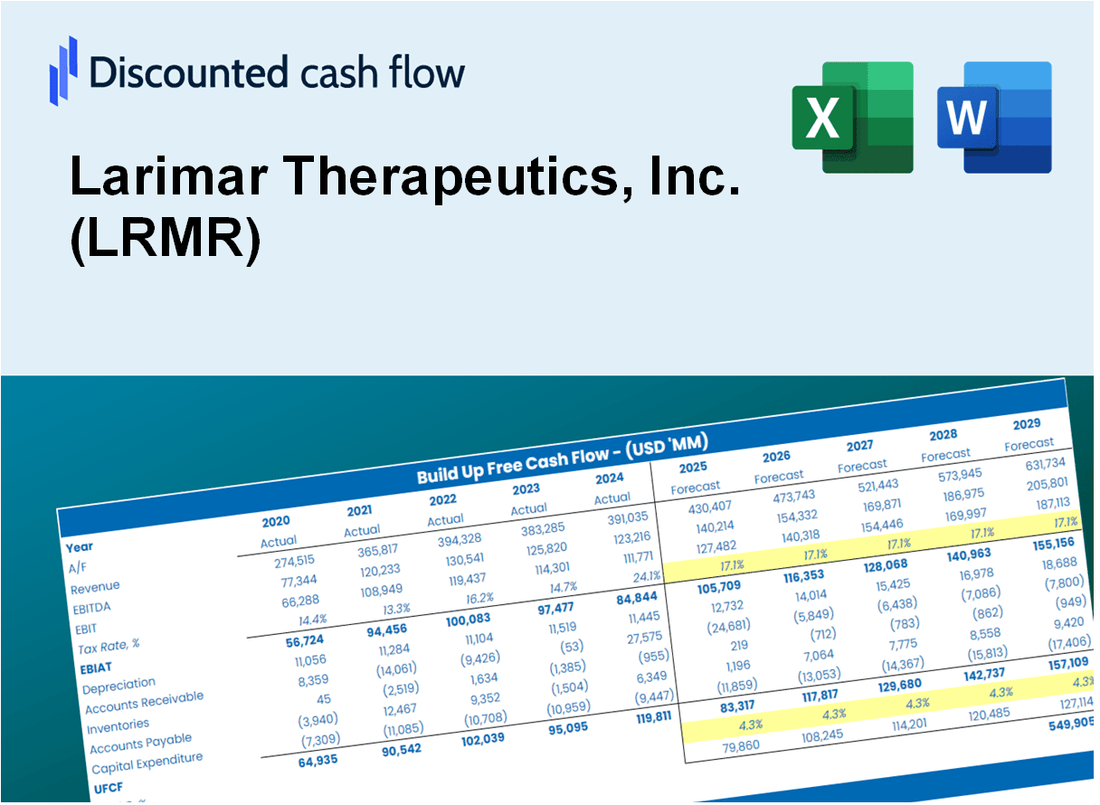
Discounted Cash Flow (DCF) - (USD MM)
| Year | AY1 2020 |
AY2 2021 |
AY3 2022 |
AY4 2023 |
AY5 2024 |
FY1 2025 |
FY2 2026 |
FY3 2027 |
FY4 2028 |
FY5 2029 |
|---|---|---|---|---|---|---|---|---|---|---|
| Revenue | .0 | .0 | .0 | .0 | .0 | .0 | .0 | .0 | .0 | .0 |
| Revenue Growth, % | 0 | 0 | 0 | 0 | 0 | 0 | 0 | 0 | 0 | 0 |
| EBITDA | -42.6 | -50.1 | -35.1 | -41.4 | -80.3 | .0 | .0 | .0 | .0 | .0 |
| EBITDA, % | 100 | 100 | 100 | 100 | 100 | 100 | 100 | 100 | 100 | 100 |
| Depreciation | .2 | .3 | .3 | .3 | .3 | .0 | .0 | .0 | .0 | .0 |
| Depreciation, % | 100 | 100 | 100 | 100 | 100 | 100 | 100 | 100 | 100 | 100 |
| EBIT | -42.8 | -50.5 | -35.4 | -41.8 | -80.6 | .0 | .0 | .0 | .0 | .0 |
| EBIT, % | 100 | 100 | 100 | 100 | 100 | 100 | 100 | 100 | 100 | 100 |
| Total Cash | 92.6 | 70.1 | 118.4 | 86.8 | 183.5 | .0 | .0 | .0 | .0 | .0 |
| Total Cash, percent | .0 | .0 | .0 | .0 | .0 | .0 | .0 | .0 | .0 | .0 |
| Account Receivables | .0 | .2 | .0 | .0 | 1.1 | .0 | .0 | .0 | .0 | .0 |
| Account Receivables, % | 100 | 100 | 100 | 100 | 100 | 100 | 100 | 100 | 100 | 100 |
| Inventories | .0 | -.2 | .0 | .0 | .0 | .0 | .0 | .0 | .0 | .0 |
| Inventories, % | 100 | 100 | 100 | 100 | 100 | 100 | 100 | 100 | 100 | 100 |
| Accounts Payable | 2.6 | 1.7 | 1.7 | 1.3 | 2.4 | .0 | .0 | .0 | .0 | .0 |
| Accounts Payable, % | 100 | 100 | 100 | 100 | 100 | 100 | 100 | 100 | 100 | 100 |
| Capital Expenditure | -.1 | -.3 | -.1 | -.2 | -.5 | .0 | .0 | .0 | .0 | .0 |
| Capital Expenditure, % | 100 | 100 | 100 | 100 | 100 | 0 | 0 | 0 | 0 | 0 |
| Tax Rate, % | 0 | 0 | 0 | 0 | 0 | 0 | 0 | 0 | 0 | 0 |
| EBITAT | -42.6 | -50.1 | -34.2 | -41.8 | -80.6 | .0 | .0 | .0 | .0 | .0 |
| Depreciation | ||||||||||
| Changes in Account Receivables | ||||||||||
| Changes in Inventories | ||||||||||
| Changes in Accounts Payable | ||||||||||
| Capital Expenditure | ||||||||||
| UFCF | -39.9 | -51.1 | -34.0 | -42.0 | -80.7 | -1.4 | .0 | .0 | .0 | .0 |
| WACC, % | 8.34 | 8.33 | 8.33 | 8.34 | 8.34 | 8.33 | 8.33 | 8.33 | 8.33 | 8.33 |
| PV UFCF | ||||||||||
| SUM PV UFCF | -1.3 | |||||||||
| Long Term Growth Rate, % | 2.00 | |||||||||
| Free cash flow (T + 1) | 0 | |||||||||
| Terminal Value | 0 | |||||||||
| Present Terminal Value | 0 | |||||||||
| Enterprise Value | -1 | |||||||||
| Net Debt | -28 | |||||||||
| Equity Value | 27 | |||||||||
| Diluted Shares Outstanding, MM | 61 | |||||||||
| Equity Value Per Share | 0.44 |
What You Will Get
- Comprehensive LRMR Financials: Access to both historical and projected data for precise valuation.
- Customizable Parameters: Adjust WACC, tax rates, revenue growth, and capital expenditures as needed.
- Real-Time Calculations: Dynamic computation of intrinsic value and NPV.
- Scenario Modeling: Evaluate various scenarios to assess Larimar Therapeutics' future performance.
- User-Friendly Design: Crafted for professionals while remaining approachable for newcomers.
Key Features
- Comprehensive DCF Calculator: Features detailed unlevered and levered DCF valuation models tailored for Larimar Therapeutics, Inc. (LRMR).
- WACC Calculator: Pre-configured Weighted Average Cost of Capital sheet with adjustable inputs specific to the biotech sector.
- Customizable Forecast Assumptions: Adjust growth projections, capital expenditures, and discount rates to fit your analysis.
- Integrated Financial Ratios: Evaluate profitability, leverage, and efficiency ratios relevant to Larimar Therapeutics, Inc. (LRMR).
- Interactive Dashboard and Charts: Visual representations of key valuation metrics for straightforward analysis and decision-making.
How It Works
- Download: Access the ready-to-use Excel file with Larimar Therapeutics, Inc.'s (LRMR) financial data.
- Customize: Adjust forecasts, including revenue growth, EBITDA %, and WACC.
- Update Automatically: The intrinsic value and NPV calculations update in real-time.
- Test Scenarios: Create multiple projections and compare outcomes instantly.
- Make Decisions: Use the valuation results to guide your investment strategy.
Why Choose Larimar Therapeutics, Inc. (LRMR)?
- Innovative Solutions: Pioneering therapies for rare diseases that address unmet medical needs.
- Expertise in Development: A dedicated team with extensive experience in biotech and pharmaceuticals.
- Commitment to Quality: Adhering to rigorous standards ensures the safety and efficacy of our treatments.
- Patient-Centric Approach: Focused on improving the lives of patients through targeted therapies.
- Proven Track Record: Backed by successful clinical trials and partnerships with leading organizations.
Who Should Use This Product?
- Investors: Accurately assess Larimar Therapeutics’ fair value before making investment choices.
- CFOs: Utilize a professional-grade DCF model for financial reporting and analysis specific to Larimar Therapeutics (LRMR).
- Consultants: Efficiently modify the template for valuation reports tailored to clients interested in Larimar Therapeutics (LRMR).
- Entrepreneurs: Acquire insights into financial modeling practices employed by leading biotech firms.
- Educators: Implement it as a teaching resource to illustrate valuation methodologies in the biotech sector.
What the Template Contains
- Operating and Balance Sheet Data: Pre-filled Larimar Therapeutics historical data and forecasts, including revenue, EBITDA, EBIT, and capital expenditures.
- WACC Calculation: A dedicated sheet for Weighted Average Cost of Capital (WACC), including parameters like Beta, risk-free rate, and share price.
- DCF Valuation (Unlevered and Levered): Editable Discounted Cash Flow models showing intrinsic value with detailed calculations.
- Financial Statements: Pre-loaded financial statements (annual and quarterly) to support analysis.
- Key Ratios: Includes profitability, leverage, and efficiency ratios for Larimar Therapeutics, Inc. (LRMR).
- Dashboard and Charts: Visual summary of valuation outputs and assumptions to analyze results easily.
Disclaimer
All information, articles, and product details provided on this website are for general informational and educational purposes only. We do not claim any ownership over, nor do we intend to infringe upon, any trademarks, copyrights, logos, brand names, or other intellectual property mentioned or depicted on this site. Such intellectual property remains the property of its respective owners, and any references here are made solely for identification or informational purposes, without implying any affiliation, endorsement, or partnership.
We make no representations or warranties, express or implied, regarding the accuracy, completeness, or suitability of any content or products presented. Nothing on this website should be construed as legal, tax, investment, financial, medical, or other professional advice. In addition, no part of this site—including articles or product references—constitutes a solicitation, recommendation, endorsement, advertisement, or offer to buy or sell any securities, franchises, or other financial instruments, particularly in jurisdictions where such activity would be unlawful.
All content is of a general nature and may not address the specific circumstances of any individual or entity. It is not a substitute for professional advice or services. Any actions you take based on the information provided here are strictly at your own risk. You accept full responsibility for any decisions or outcomes arising from your use of this website and agree to release us from any liability in connection with your use of, or reliance upon, the content or products found herein.