
|
Lulu's Fashion Lounge Holdings ، Inc. (LVLU) DCF تقييم |
Fully Editable: Tailor To Your Needs In Excel Or Sheets
Professional Design: Trusted, Industry-Standard Templates
Investor-Approved Valuation Models
MAC/PC Compatible, Fully Unlocked
No Expertise Is Needed; Easy To Follow
Lulu's Fashion Lounge Holdings, Inc. (LVLU) Bundle
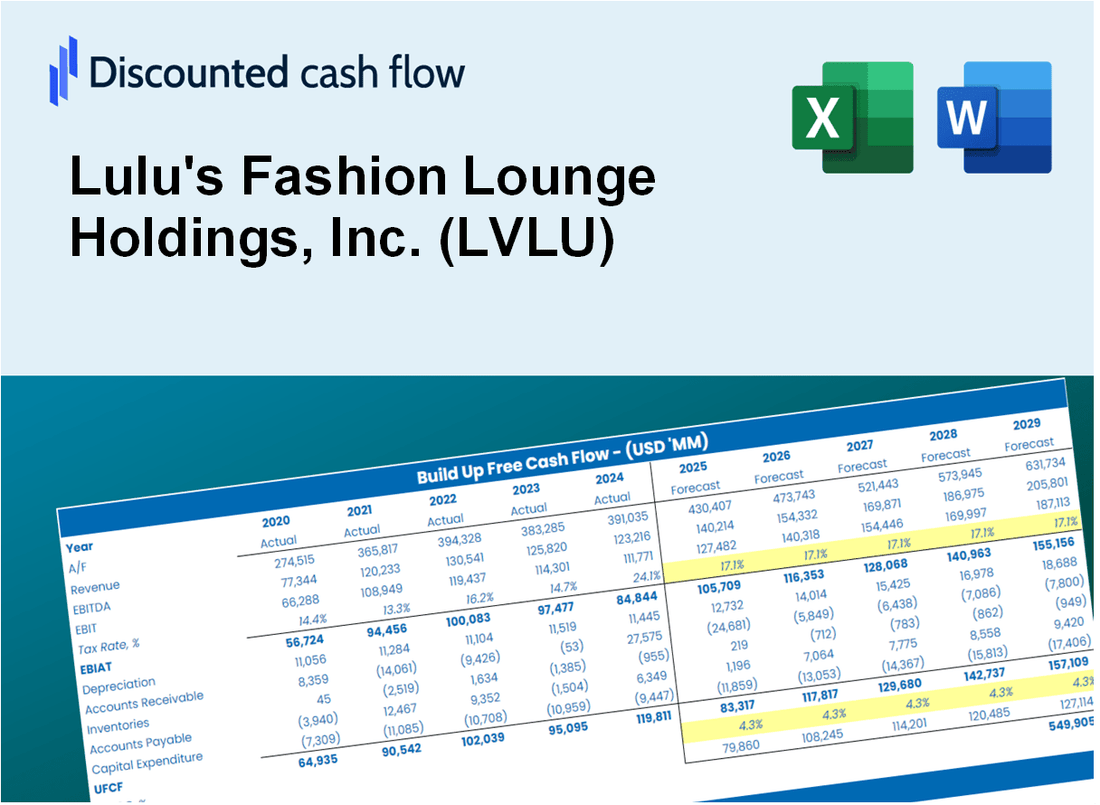
اكتساب نظرة ثاقبة على تحليل تقييم LULU's Fashion Lounge Holdings ، Inc. (LVLU) مع حاسبة DCF القوية لدينا! مجهز ببيانات LVLU الحقيقية ، يمكّنك هذا القالب Excel من ضبط التنبؤات والافتراضات لتحديد القيمة الجوهرية لـ Lulu's Fashion Lounge Holdings ، Inc.
What You Will Get
- Pre-Filled Financial Model: Lulu's actual financial data provides an accurate DCF valuation.
- Full Forecast Control: Modify revenue growth, profit margins, WACC, and other essential factors.
- Instant Calculations: Automatic updates let you view results in real-time as you make adjustments.
- Investor-Ready Template: A polished Excel file crafted for high-quality valuation presentations.
- Customizable and Reusable: Designed for adaptability, enabling repeated use for comprehensive forecasts.
Key Features
- Comprehensive Financial Data: Lulu's historical financial statements and pre-filled projections.
- Customizable Parameters: Adjust WACC, tax rates, revenue growth, and EBITDA margins as needed.
- Real-Time Valuation: Observe Lulu's intrinsic value recalculating instantly.
- Intuitive Visualizations: Dashboard graphs showcase valuation outcomes and essential metrics.
- Designed for Precision: A reliable tool for analysts, investors, and finance professionals.
How It Works
- Download the Template: Gain immediate access to the Excel-based LVLU DCF Calculator.
- Input Your Assumptions: Modify the yellow-highlighted cells for growth rates, WACC, margins, and additional factors.
- Instant Calculations: The model automatically refreshes LVLU's intrinsic value.
- Test Scenarios: Experiment with various assumptions to assess potential valuation shifts.
- Analyze and Decide: Utilize the findings to inform your investment or financial strategy.
Why Choose This Calculator for Lulu's Fashion Lounge Holdings, Inc. (LVLU)?
- All-in-One Solution: Combines DCF, WACC, and financial ratio analyses tailored for LVLU.
- Flexible Inputs: Modify yellow-highlighted cells to explore different financial scenarios.
- In-Depth Analysis: Automatically computes Lulu's intrinsic value and Net Present Value.
- Preloaded Information: Access to historical and projected data for precise calculations.
- Expert-Level Tool: Perfect for financial analysts, investors, and business advisors focusing on LVLU.
Who Should Use This Product?
- Fashion Industry Investors: Develop comprehensive valuation models for analyzing investments in the fashion sector.
- Retail Finance Teams: Evaluate valuation scenarios to inform strategic decisions within retail operations.
- Consultants and Advisors: Deliver precise valuation insights for Lulu's Fashion Lounge Holdings, Inc. (LVLU) to clients.
- Students and Educators: Utilize real-world data to enhance learning and practice in financial modeling related to fashion retail.
- Fashion Enthusiasts: Gain insights into how fashion companies like Lulu's are valued in the marketplace.
What the Template Contains
- Pre-Filled DCF Model: Lulu's Fashion Lounge Holdings, Inc.'s (LVLU) financial data preloaded for immediate use.
- WACC Calculator: Detailed calculations for Weighted Average Cost of Capital.
- Financial Ratios: Evaluate Lulu's profitability, leverage, and efficiency.
- Editable Inputs: Change assumptions such as growth, margins, and CAPEX to fit your scenarios.
- Financial Statements: Annual and quarterly reports to support detailed analysis.
- Interactive Dashboard: Easily visualize key valuation metrics and results.
Disclaimer
All information, articles, and product details provided on this website are for general informational and educational purposes only. We do not claim any ownership over, nor do we intend to infringe upon, any trademarks, copyrights, logos, brand names, or other intellectual property mentioned or depicted on this site. Such intellectual property remains the property of its respective owners, and any references here are made solely for identification or informational purposes, without implying any affiliation, endorsement, or partnership.
We make no representations or warranties, express or implied, regarding the accuracy, completeness, or suitability of any content or products presented. Nothing on this website should be construed as legal, tax, investment, financial, medical, or other professional advice. In addition, no part of this site—including articles or product references—constitutes a solicitation, recommendation, endorsement, advertisement, or offer to buy or sell any securities, franchises, or other financial instruments, particularly in jurisdictions where such activity would be unlawful.
All content is of a general nature and may not address the specific circumstances of any individual or entity. It is not a substitute for professional advice or services. Any actions you take based on the information provided here are strictly at your own risk. You accept full responsibility for any decisions or outcomes arising from your use of this website and agree to release us from any liability in connection with your use of, or reliance upon, the content or products found herein.