
|
Mid-America Apartment Communities ، Inc. (MAA) DCF تقييم |
Fully Editable: Tailor To Your Needs In Excel Or Sheets
Professional Design: Trusted, Industry-Standard Templates
Investor-Approved Valuation Models
MAC/PC Compatible, Fully Unlocked
No Expertise Is Needed; Easy To Follow
Mid-America Apartment Communities, Inc. (MAA) Bundle
تم تصميم حاسبة DCF الخاصة بنا (MAA) ، التي تم تصميمها من أجل الدقة (MAA) الخاصة بنا بتقييم تقييم Mid-America Apartment Communities ، Inc. باستخدام البيانات المالية في العالم الحقيقي وتوفر مرونة كاملة لتعديل جميع المعلمات الرئيسية للتوقعات المحسنة.
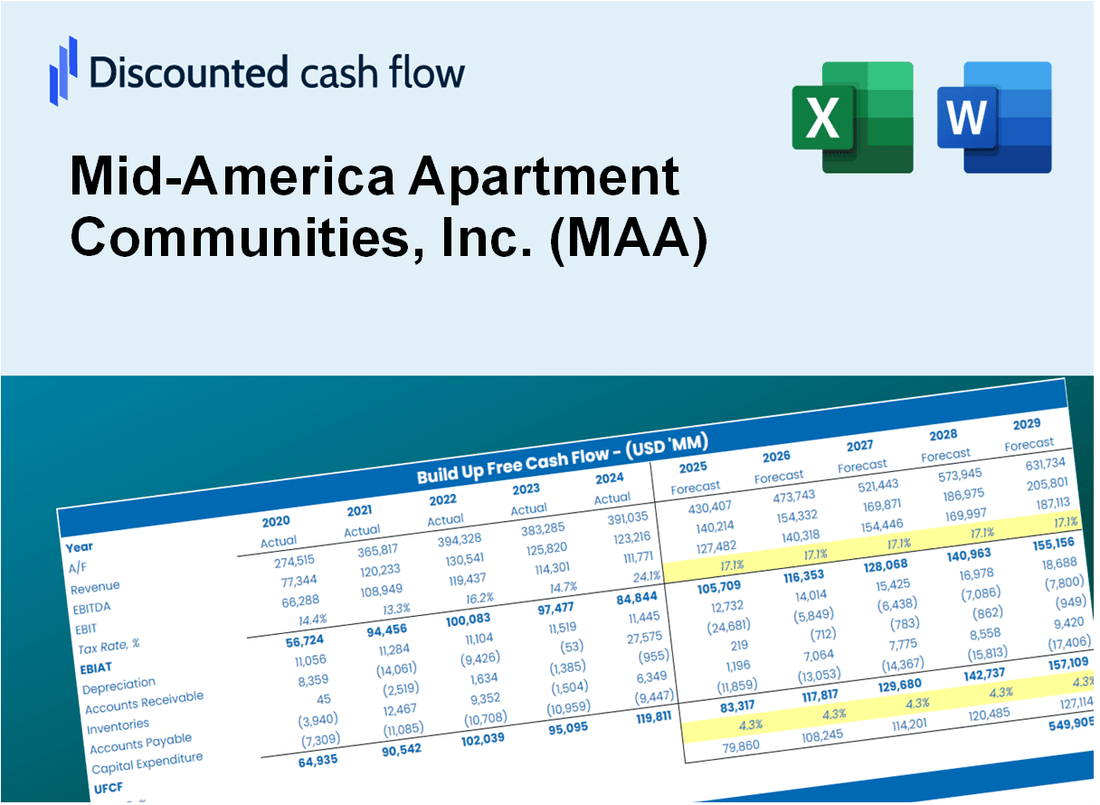
Discounted Cash Flow (DCF) - (USD MM)
| Year | AY1 2020 |
AY2 2021 |
AY3 2022 |
AY4 2023 |
AY5 2024 |
FY1 2025 |
FY2 2026 |
FY3 2027 |
FY4 2028 |
FY5 2029 |
|---|---|---|---|---|---|---|---|---|---|---|
| Revenue | 1,678.0 | 1,778.1 | 2,019.9 | 2,148.5 | 2,191.0 | 2,343.9 | 2,507.4 | 2,682.4 | 2,869.6 | 3,069.8 |
| Revenue Growth, % | 0 | 5.97 | 13.6 | 6.37 | 1.98 | 6.98 | 6.98 | 6.98 | 6.98 | 6.98 |
| EBITDA | 945.1 | 1,254.4 | 1,345.7 | 1,285.9 | 1,299.8 | 1,465.8 | 1,568.0 | 1,677.4 | 1,794.5 | 1,919.7 |
| EBITDA, % | 56.32 | 70.55 | 66.63 | 59.85 | 59.32 | 62.54 | 62.54 | 62.54 | 62.54 | 62.54 |
| Depreciation | 511.7 | 534.4 | 544.0 | 565.9 | 586.4 | 659.0 | 705.0 | 754.2 | 806.8 | 863.1 |
| Depreciation, % | 30.49 | 30.06 | 26.93 | 26.34 | 26.76 | 28.12 | 28.12 | 28.12 | 28.12 | 28.12 |
| EBIT | 433.4 | 720.0 | 801.7 | 720.1 | 713.4 | 806.7 | 863.0 | 923.2 | 987.7 | 1,056.6 |
| EBIT, % | 25.83 | 40.49 | 39.69 | 33.52 | 32.56 | 34.42 | 34.42 | 34.42 | 34.42 | 34.42 |
| Total Cash | 25.2 | 54.3 | 38.7 | 41.3 | 43.0 | 48.5 | 51.9 | 55.6 | 59.4 | 63.6 |
| Total Cash, percent | .0 | .0 | .0 | .0 | .0 | .0 | .0 | .0 | .0 | .0 |
| Account Receivables | .0 | .0 | .0 | .0 | .0 | .0 | .0 | .0 | .0 | .0 |
| Account Receivables, % | 0 | 0 | 0 | 0 | 0 | 0 | 0 | 0 | 0 | 0 |
| Inventories | .0 | .0 | .0 | .0 | .0 | .0 | .0 | .0 | .0 | .0 |
| Inventories, % | 0 | 0 | 0 | 0 | 0 | 0 | 0 | 0 | 0 | 0 |
| Accounts Payable | .0 | .0 | 102.0 | 94.5 | 124.8 | 71.0 | 75.9 | 81.2 | 86.9 | 93.0 |
| Accounts Payable, % | 0 | 0 | 5.05 | 4.4 | 5.7 | 3.03 | 3.03 | 3.03 | 3.03 | 3.03 |
| Capital Expenditure | -225.5 | -511.3 | -296.2 | -341.2 | -322.4 | -410.0 | -438.6 | -469.2 | -501.9 | -536.9 |
| Capital Expenditure, % | -13.44 | -28.75 | -14.66 | -15.88 | -14.71 | -17.49 | -17.49 | -17.49 | -17.49 | -17.49 |
| Tax Rate, % | 3.18 | 3.18 | 3.18 | 3.18 | 3.18 | 3.18 | 3.18 | 3.18 | 3.18 | 3.18 |
| EBITAT | 415.1 | 682.5 | 789.9 | 697.3 | 690.7 | 778.9 | 833.3 | 891.4 | 953.6 | 1,020.1 |
| Depreciation | ||||||||||
| Changes in Account Receivables | ||||||||||
| Changes in Inventories | ||||||||||
| Changes in Accounts Payable | ||||||||||
| Capital Expenditure | ||||||||||
| UFCF | 701.3 | 705.6 | 1,139.7 | 914.4 | 985.1 | 974.1 | 1,104.7 | 1,181.7 | 1,264.2 | 1,352.4 |
| WACC, % | 6.46 | 6.45 | 6.49 | 6.47 | 6.47 | 6.47 | 6.47 | 6.47 | 6.47 | 6.47 |
| PV UFCF | ||||||||||
| SUM PV UFCF | 4,841.2 | |||||||||
| Long Term Growth Rate, % | 4.00 | |||||||||
| Free cash flow (T + 1) | 1,406 | |||||||||
| Terminal Value | 57,004 | |||||||||
| Present Terminal Value | 41,670 | |||||||||
| Enterprise Value | 46,511 | |||||||||
| Net Debt | 4,964 | |||||||||
| Equity Value | 41,547 | |||||||||
| Diluted Shares Outstanding, MM | 117 | |||||||||
| Equity Value Per Share | 355.78 |
What You Will Get
- Pre-Filled Financial Model: MAA's actual data enables precise DCF valuation.
- Full Forecast Control: Adjust revenue growth, margins, WACC, and other key drivers.
- Instant Calculations: Automatic updates ensure you see results as you make changes.
- Investor-Ready Template: A refined Excel file designed for professional-grade valuation.
- Customizable and Reusable: Tailored for flexibility, allowing repeated use for detailed forecasts.
Key Features
- Comprehensive DCF Calculator: Features detailed unlevered and levered DCF valuation models tailored for Mid-America Apartment Communities, Inc. (MAA).
- WACC Calculator: Ready-to-use Weighted Average Cost of Capital sheet with adjustable inputs for accurate analysis.
- Customizable Forecast Assumptions: Adjust growth rates, capital expenditures, and discount rates to fit your projections.
- Integrated Financial Ratios: Evaluate profitability, leverage, and efficiency ratios specifically for Mid-America Apartment Communities, Inc. (MAA).
- Visual Dashboard and Charts: Graphical representations of key valuation metrics for straightforward analysis.
How It Works
- Step 1: Download the prebuilt Excel template featuring Mid-America Apartment Communities, Inc.'s (MAA) data.
- Step 2: Navigate through the pre-filled sheets to familiarize yourself with the essential metrics.
- Step 3: Modify forecasts and assumptions in the editable yellow cells (WACC, growth, margins).
- Step 4: Instantly view updated results, including Mid-America Apartment Communities, Inc.'s (MAA) intrinsic value.
- Step 5: Make informed investment choices or create reports based on the generated outputs.
Why Choose This Calculator for Mid-America Apartment Communities, Inc. (MAA)?
- Comprehensive Tool: Offers DCF, WACC, and financial ratio analyses tailored for MAA.
- Customizable Inputs: Modify the highlighted cells to explore different investment scenarios.
- Detailed Insights: Automatically computes MAA’s intrinsic value and Net Present Value.
- Preloaded Data: Access historical and projected data for precise analysis.
- Professional Quality: Perfect for financial analysts, investors, and real estate consultants focusing on MAA.
Who Should Use Mid-America Apartment Communities, Inc. (MAA)?
- Real Estate Investors: Make informed investment decisions with reliable data on multifamily properties.
- Market Analysts: Utilize comprehensive market insights to enhance your analysis and reports.
- Property Managers: Streamline operations and improve tenant satisfaction with our innovative solutions.
- Finance Professionals: Gain a deeper understanding of real estate investment dynamics through detailed case studies.
- Students and Educators: Leverage our resources for practical applications in real estate and finance education.
What the Template Contains
- Historical Data: Includes Mid-America Apartment Communities, Inc.'s (MAA) past financials and baseline forecasts.
- DCF and Levered DCF Models: Detailed templates to calculate Mid-America Apartment Communities, Inc.'s (MAA) intrinsic value.
- WACC Sheet: Pre-built calculations for Weighted Average Cost of Capital.
- Editable Inputs: Modify key drivers like growth rates, EBITDA %, and CAPEX assumptions.
- Quarterly and Annual Statements: A complete breakdown of Mid-America Apartment Communities, Inc.'s (MAA) financials.
- Interactive Dashboard: Visualize valuation results and projections dynamically.
Disclaimer
All information, articles, and product details provided on this website are for general informational and educational purposes only. We do not claim any ownership over, nor do we intend to infringe upon, any trademarks, copyrights, logos, brand names, or other intellectual property mentioned or depicted on this site. Such intellectual property remains the property of its respective owners, and any references here are made solely for identification or informational purposes, without implying any affiliation, endorsement, or partnership.
We make no representations or warranties, express or implied, regarding the accuracy, completeness, or suitability of any content or products presented. Nothing on this website should be construed as legal, tax, investment, financial, medical, or other professional advice. In addition, no part of this site—including articles or product references—constitutes a solicitation, recommendation, endorsement, advertisement, or offer to buy or sell any securities, franchises, or other financial instruments, particularly in jurisdictions where such activity would be unlawful.
All content is of a general nature and may not address the specific circumstances of any individual or entity. It is not a substitute for professional advice or services. Any actions you take based on the information provided here are strictly at your own risk. You accept full responsibility for any decisions or outcomes arising from your use of this website and agree to release us from any liability in connection with your use of, or reliance upon, the content or products found herein.