
|
Maxeon Solar Technologies ، Ltd. (Maxn) DCF تقييم |
Fully Editable: Tailor To Your Needs In Excel Or Sheets
Professional Design: Trusted, Industry-Standard Templates
Investor-Approved Valuation Models
MAC/PC Compatible, Fully Unlocked
No Expertise Is Needed; Easy To Follow
Maxeon Solar Technologies, Ltd. (MAXN) Bundle
عزز خيارات الاستثمار الخاصة بك مع حاسبة Maxeon Solar Technologies ، Ltd. (MAXN) DCF! الاستفادة من البيانات المالية Maxeon الأصلية ، وضبط توقعات النمو والنفقات ، ومراقبة على الفور كيف تؤثر هذه التعديلات على القيمة الجوهرية لـ (MAXN).
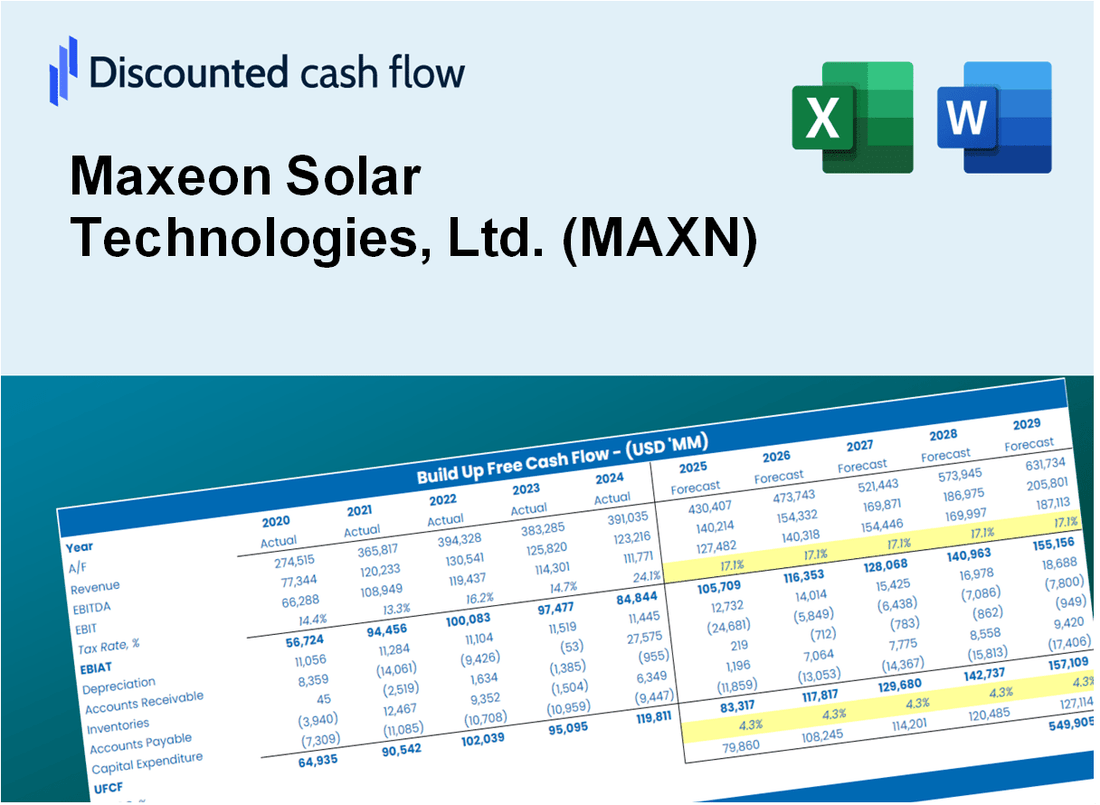
Discounted Cash Flow (DCF) - (USD MM)
| Year | AY1 2020 |
AY2 2021 |
AY3 2022 |
AY4 2023 |
AY5 2024 |
FY1 2025 |
FY2 2026 |
FY3 2027 |
FY4 2028 |
FY5 2029 |
|---|---|---|---|---|---|---|---|---|---|---|
| Revenue | 844.8 | 783.3 | 1,060.1 | 1,123.1 | 509.0 | 482.7 | 457.8 | 434.1 | 411.7 | 390.4 |
| Revenue Growth, % | 0 | -7.29 | 35.34 | 5.94 | -54.68 | -5.17 | -5.17 | -5.17 | -5.17 | -5.17 |
| EBITDA | -46.5 | -169.0 | -141.3 | -175.2 | -507.8 | -150.4 | -142.6 | -135.2 | -128.3 | -121.6 |
| EBITDA, % | -5.5 | -21.58 | -13.33 | -15.6 | -99.75 | -31.15 | -31.15 | -31.15 | -31.15 | -31.15 |
| Depreciation | 47.3 | 42.2 | 56.7 | 55.9 | 43.5 | 28.8 | 27.3 | 25.9 | 24.6 | 23.3 |
| Depreciation, % | 5.6 | 5.39 | 5.35 | 4.98 | 8.54 | 5.97 | 5.97 | 5.97 | 5.97 | 5.97 |
| EBIT | -93.8 | -211.2 | -198.1 | -231.1 | -551.3 | -171.2 | -162.4 | -154.0 | -146.0 | -138.5 |
| EBIT, % | -11.11 | -26.97 | -18.68 | -20.58 | -108.29 | -35.47 | -35.47 | -35.47 | -35.47 | -35.47 |
| Total Cash | 206.7 | 166.5 | 303.4 | 190.2 | 28.9 | 93.6 | 88.8 | 84.2 | 79.8 | 75.7 |
| Total Cash, percent | .0 | .0 | .0 | .0 | .0 | .0 | .0 | .0 | .0 | .0 |
| Account Receivables | 102.1 | 80.3 | 114.5 | 92.2 | 12.6 | 42.3 | 40.1 | 38.0 | 36.1 | 34.2 |
| Account Receivables, % | 12.09 | 10.25 | 10.8 | 8.21 | 2.47 | 8.76 | 8.76 | 8.76 | 8.76 | 8.76 |
| Inventories | 169.2 | 263.9 | 303.2 | 308.9 | 40.2 | 113.7 | 107.8 | 102.2 | 96.9 | 91.9 |
| Inventories, % | 20.03 | 33.69 | 28.6 | 27.51 | 7.9 | 23.55 | 23.55 | 23.55 | 23.55 | 23.55 |
| Accounts Payable | 159.2 | 270.5 | 247.9 | 153.0 | 62.5 | 99.1 | 94.0 | 89.1 | 84.5 | 80.2 |
| Accounts Payable, % | 18.84 | 34.53 | 23.38 | 13.62 | 12.29 | 20.53 | 20.53 | 20.53 | 20.53 | 20.53 |
| Capital Expenditure | -27.7 | -154.7 | -63.5 | -67.6 | -52.2 | -43.7 | -41.5 | -39.3 | -37.3 | -35.4 |
| Capital Expenditure, % | -3.28 | -19.75 | -5.99 | -6.02 | -10.25 | -9.06 | -9.06 | -9.06 | -9.06 | -9.06 |
| Tax Rate, % | -2.96 | -2.96 | -2.96 | -2.96 | -2.96 | -2.96 | -2.96 | -2.96 | -2.96 | -2.96 |
| EBITAT | -103.8 | -210.4 | -225.4 | -230.7 | -567.6 | -171.0 | -162.2 | -153.8 | -145.8 | -138.3 |
| Depreciation | ||||||||||
| Changes in Account Receivables | ||||||||||
| Changes in Inventories | ||||||||||
| Changes in Accounts Payable | ||||||||||
| Capital Expenditure | ||||||||||
| UFCF | -196.4 | -284.3 | -328.3 | -320.7 | -318.4 | -252.5 | -173.3 | -164.4 | -155.9 | -147.8 |
| WACC, % | 14.09 | 14.03 | 14.09 | 14.06 | 14.09 | 14.07 | 14.07 | 14.07 | 14.07 | 14.07 |
| PV UFCF | ||||||||||
| SUM PV UFCF | -634.0 | |||||||||
| Long Term Growth Rate, % | 2.00 | |||||||||
| Free cash flow (T + 1) | -151 | |||||||||
| Terminal Value | -1,249 | |||||||||
| Present Terminal Value | -647 | |||||||||
| Enterprise Value | -1,281 | |||||||||
| Net Debt | 283 | |||||||||
| Equity Value | -1,563 | |||||||||
| Diluted Shares Outstanding, MM | 8 | |||||||||
| Equity Value Per Share | -187.77 |
What You Will Get
- Real MAXN Financials: Access to historical and projected data for precise valuation.
- Customizable Inputs: Adjust WACC, tax rates, revenue growth, and capital expenses as needed.
- Dynamic Calculations: Intrinsic value and NPV are computed in real-time.
- Scenario Analysis: Explore various scenarios to assess Maxeon’s future performance.
- User-Friendly Design: Designed for professionals while remaining approachable for newcomers.
Key Features
- Pre-Loaded Data: Maxeon Solar's historical financial statements and pre-filled forecasts.
- Fully Adjustable Inputs: Modify WACC, tax rates, revenue growth, and EBITDA margins.
- Instant Results: View Maxeon's intrinsic value recalculating in real time.
- Clear Visual Outputs: Dashboard charts present valuation results and key metrics.
- Built for Accuracy: A professional tool designed for analysts, investors, and finance experts.
How It Works
- Step 1: Download the Excel file.
- Step 2: Review Maxeon Solar Technologies' pre-filled financial data and forecasts.
- Step 3: Modify critical inputs such as revenue growth, WACC, and tax rates (highlighted cells).
- Step 4: Watch the DCF model update instantly as you adjust your assumptions.
- Step 5: Analyze the outputs and leverage the results for investment decisions.
Why Choose This Calculator?
- Accuracy: Utilizes real Maxeon Solar financial data for precise calculations.
- Flexibility: Allows users to effortlessly adjust and test various inputs.
- Time-Saving: Eliminate the need to create a DCF model from the ground up.
- Professional-Grade: Crafted with the precision and usability expected at the CFO level.
- User-Friendly: Intuitive design caters to users with all levels of financial modeling expertise.
Who Should Use Maxeon Solar Technologies, Ltd. (MAXN)?
- Investors: Make informed decisions with a leading-edge solar technology investment analysis tool.
- Financial Analysts: Streamline your workflow with a pre-configured financial model tailored for solar energy companies.
- Consultants: Easily modify the template for client proposals or sustainability reports.
- Energy Enthusiasts: Enhance your knowledge of solar technology and its market potential through practical case studies.
- Educators and Students: Utilize it as a hands-on resource in renewable energy and finance courses.
What the Maxeon Solar Technologies Template Contains
- Preloaded MAXN Data: Historical and projected financial data, including revenue, EBIT, and capital expenditures.
- DCF and WACC Models: Professional-grade sheets for calculating intrinsic value and Weighted Average Cost of Capital.
- Editable Inputs: Yellow-highlighted cells for adjusting revenue growth, tax rates, and discount rates.
- Financial Statements: Comprehensive annual and quarterly financials for deeper analysis.
- Key Ratios: Profitability, leverage, and efficiency ratios to evaluate performance.
- Dashboard and Charts: Visual summaries of valuation outcomes and assumptions.
Disclaimer
All information, articles, and product details provided on this website are for general informational and educational purposes only. We do not claim any ownership over, nor do we intend to infringe upon, any trademarks, copyrights, logos, brand names, or other intellectual property mentioned or depicted on this site. Such intellectual property remains the property of its respective owners, and any references here are made solely for identification or informational purposes, without implying any affiliation, endorsement, or partnership.
We make no representations or warranties, express or implied, regarding the accuracy, completeness, or suitability of any content or products presented. Nothing on this website should be construed as legal, tax, investment, financial, medical, or other professional advice. In addition, no part of this site—including articles or product references—constitutes a solicitation, recommendation, endorsement, advertisement, or offer to buy or sell any securities, franchises, or other financial instruments, particularly in jurisdictions where such activity would be unlawful.
All content is of a general nature and may not address the specific circumstances of any individual or entity. It is not a substitute for professional advice or services. Any actions you take based on the information provided here are strictly at your own risk. You accept full responsibility for any decisions or outcomes arising from your use of this website and agree to release us from any liability in connection with your use of, or reliance upon, the content or products found herein.