
|
شركة Moody's Corporation (MCO) DCF |
Fully Editable: Tailor To Your Needs In Excel Or Sheets
Professional Design: Trusted, Industry-Standard Templates
Investor-Approved Valuation Models
MAC/PC Compatible, Fully Unlocked
No Expertise Is Needed; Easy To Follow
Moody's Corporation (MCO) Bundle
تبحث لتحديد القيمة الجوهرية لشركة Moody؟ يدمج حاسبة DCF (MCO) DCF بيانات العالم الحقيقي مع ميزات تخصيص شاملة ، مما يتيح لك ضبط التنبؤات وتعزيز استراتيجيات الاستثمار الخاصة بك.
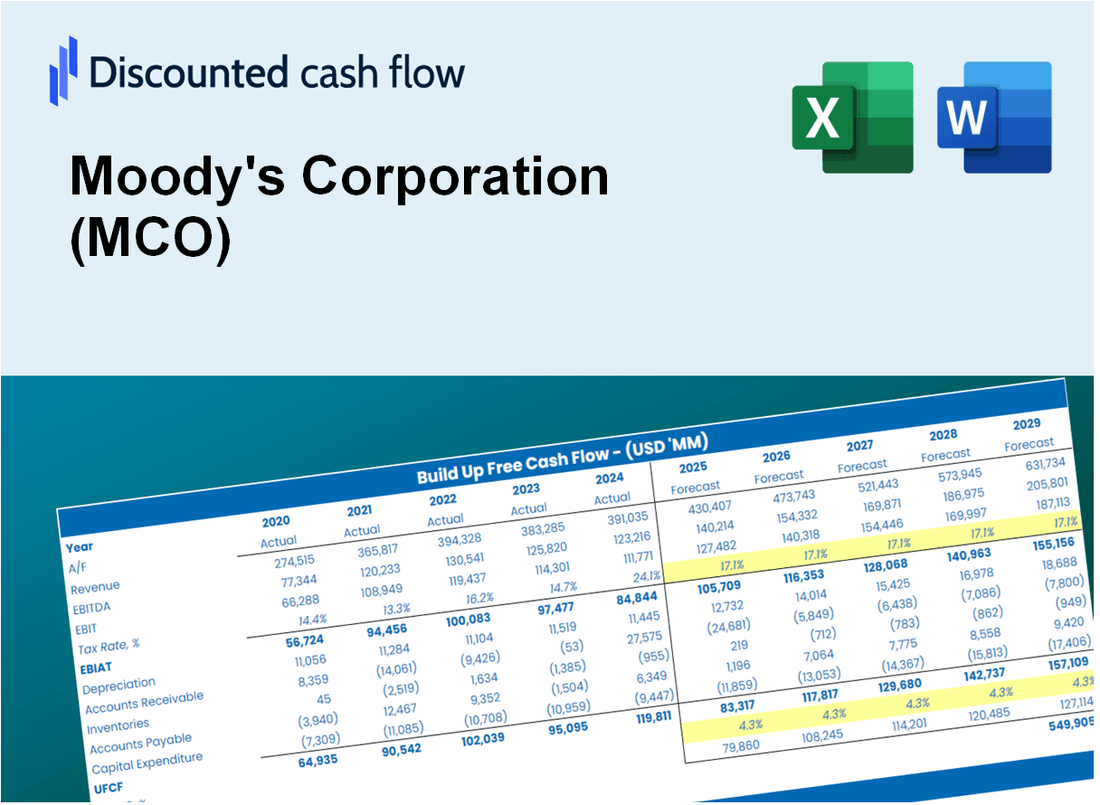
Discounted Cash Flow (DCF) - (USD MM)
| Year | AY1 2020 |
AY2 2021 |
AY3 2022 |
AY4 2023 |
AY5 2024 |
FY1 2025 |
FY2 2026 |
FY3 2027 |
FY4 2028 |
FY5 2029 |
|---|---|---|---|---|---|---|---|---|---|---|
| Revenue | 5,371.0 | 6,218.0 | 5,468.0 | 5,916.0 | 7,088.0 | 7,649.9 | 8,256.4 | 8,911.0 | 9,617.4 | 10,379.9 |
| Revenue Growth, % | 0 | 15.77 | -12.06 | 8.19 | 19.81 | 7.93 | 7.93 | 7.93 | 7.93 | 7.93 |
| EBITDA | 2,681.0 | 3,255.0 | 2,307.0 | 2,515.0 | 3,334.0 | 3,580.2 | 3,864.1 | 4,170.4 | 4,501.0 | 4,857.9 |
| EBITDA, % | 49.92 | 52.35 | 42.19 | 42.51 | 47.04 | 46.8 | 46.8 | 46.8 | 46.8 | 46.8 |
| Depreciation | 220.0 | 257.0 | 331.0 | 373.0 | 431.0 | 408.0 | 440.4 | 475.3 | 513.0 | 553.6 |
| Depreciation, % | 4.1 | 4.13 | 6.05 | 6.3 | 6.08 | 5.33 | 5.33 | 5.33 | 5.33 | 5.33 |
| EBIT | 2,461.0 | 2,998.0 | 1,976.0 | 2,142.0 | 2,903.0 | 3,172.2 | 3,423.7 | 3,695.1 | 3,988.1 | 4,304.3 |
| EBIT, % | 45.82 | 48.21 | 36.14 | 36.21 | 40.96 | 41.47 | 41.47 | 41.47 | 41.47 | 41.47 |
| Total Cash | 2,696.0 | 1,902.0 | 1,859.0 | 2,193.0 | 2,974.0 | 2,965.3 | 3,200.3 | 3,454.1 | 3,727.9 | 4,023.4 |
| Total Cash, percent | .0 | .0 | .0 | .0 | .0 | .0 | .0 | .0 | .0 | .0 |
| Account Receivables | 1,430.0 | 1,720.0 | 1,652.0 | 1,738.0 | 1,878.0 | 2,147.7 | 2,317.9 | 2,501.7 | 2,700.0 | 2,914.1 |
| Account Receivables, % | 26.62 | 27.66 | 30.21 | 29.38 | 26.5 | 28.07 | 28.07 | 28.07 | 28.07 | 28.07 |
| Inventories | .0 | .0 | .0 | .0 | .0 | .0 | .0 | .0 | .0 | .0 |
| Inventories, % | 0 | 0 | 0 | 0 | 0 | 0 | 0 | 0 | 0 | 0 |
| Accounts Payable | 39.0 | 47.0 | 52.0 | 23.0 | 53.0 | 54.6 | 58.9 | 63.6 | 68.7 | 74.1 |
| Accounts Payable, % | 0.72612 | 0.75587 | 0.95099 | 0.38878 | 0.74774 | 0.7139 | 0.7139 | 0.7139 | 0.7139 | 0.7139 |
| Capital Expenditure | -103.0 | -139.0 | -283.0 | -271.0 | -317.0 | -281.2 | -303.5 | -327.6 | -353.6 | -381.6 |
| Capital Expenditure, % | -1.92 | -2.24 | -5.18 | -4.58 | -4.47 | -3.68 | -3.68 | -3.68 | -3.68 | -3.68 |
| Tax Rate, % | 23.75 | 23.75 | 23.75 | 23.75 | 23.75 | 23.75 | 23.75 | 23.75 | 23.75 | 23.75 |
| EBITAT | 1,963.1 | 2,409.3 | 1,542.6 | 1,778.9 | 2,213.6 | 2,521.9 | 2,721.8 | 2,937.6 | 3,170.5 | 3,421.9 |
| Depreciation | ||||||||||
| Changes in Account Receivables | ||||||||||
| Changes in Inventories | ||||||||||
| Changes in Accounts Payable | ||||||||||
| Capital Expenditure | ||||||||||
| UFCF | 689.1 | 2,245.3 | 1,663.6 | 1,765.9 | 2,217.6 | 2,380.6 | 2,692.7 | 2,906.2 | 3,136.6 | 3,385.3 |
| WACC, % | 9.64 | 9.65 | 9.64 | 9.65 | 9.63 | 9.64 | 9.64 | 9.64 | 9.64 | 9.64 |
| PV UFCF | ||||||||||
| SUM PV UFCF | 10,922.7 | |||||||||
| Long Term Growth Rate, % | 2.00 | |||||||||
| Free cash flow (T + 1) | 3,453 | |||||||||
| Terminal Value | 45,175 | |||||||||
| Present Terminal Value | 28,509 | |||||||||
| Enterprise Value | 39,432 | |||||||||
| Net Debt | 5,338 | |||||||||
| Equity Value | 34,094 | |||||||||
| Diluted Shares Outstanding, MM | 183 | |||||||||
| Equity Value Per Share | 186.61 |
What You Will Gain
- Comprehensive Financial Model: Moody's actual data allows for accurate DCF valuation.
- Complete Forecast Flexibility: Modify revenue growth, profit margins, WACC, and other essential factors.
- Real-Time Calculations: Automatic updates provide immediate feedback as changes are made.
- Professional-Grade Template: A polished Excel file crafted for high-quality valuation.
- Adaptable and Reusable: Designed for versatility, enabling repeated use for in-depth forecasts.
Key Features
- 🔍 Real-Life MCO Financials: Pre-filled historical and projected data for Moody's Corporation (MCO).
- ✏️ Fully Customizable Inputs: Adjust all critical parameters (yellow cells) like WACC, growth %, and tax rates.
- 📊 Professional DCF Valuation: Built-in formulas calculate Moody's intrinsic value using the Discounted Cash Flow method.
- ⚡ Instant Results: Visualize Moody's valuation instantly after making changes.
- Scenario Analysis: Test and compare outcomes for various financial assumptions side-by-side.
How It Works
- Download the Template: Get instant access to the Excel-based MCO DCF Calculator.
- Input Your Assumptions: Adjust yellow-highlighted cells for growth rates, WACC, margins, and more.
- Instant Calculations: The model automatically updates Moody's intrinsic value.
- Test Scenarios: Simulate different assumptions to evaluate potential valuation changes.
- Analyze and Decide: Use the results to guide your investment or financial analysis.
Why Choose This Calculator for Moody's Corporation (MCO)?
- Accuracy: Utilizes real Moody's financial data to ensure precision.
- Flexibility: Designed for users to easily adjust and experiment with inputs.
- Time-Saving: Avoid the complexity of creating a DCF model from the ground up.
- Professional-Grade: Crafted with the expertise and usability expected by financial professionals.
- User-Friendly: Intuitive interface suitable for users without extensive financial modeling knowledge.
Who Should Use This Product?
- Investors: Evaluate Moody's Corporation (MCO) for informed stock trading decisions.
- CFOs and Financial Analysts: Enhance valuation methodologies and validate financial forecasts.
- Startup Founders: Discover how established firms like Moody's Corporation (MCO) are appraised in the market.
- Consultants: Provide clients with expert valuation assessments and reports.
- Students and Educators: Utilize current data to learn and teach valuation strategies effectively.
What the Template Contains
- Comprehensive DCF Model: Editable template featuring detailed valuation calculations tailored for Moody's Corporation (MCO).
- Real-World Data: Moody's historical and projected financials preloaded for in-depth analysis.
- Customizable Parameters: Modify WACC, growth rates, and tax assumptions to explore various scenarios.
- Financial Statements: Complete annual and quarterly breakdowns for enhanced insights into performance.
- Key Ratios: Integrated analysis for profitability, efficiency, and leverage metrics.
- Dashboard with Visual Outputs: Interactive charts and tables for clear, actionable results.
Disclaimer
All information, articles, and product details provided on this website are for general informational and educational purposes only. We do not claim any ownership over, nor do we intend to infringe upon, any trademarks, copyrights, logos, brand names, or other intellectual property mentioned or depicted on this site. Such intellectual property remains the property of its respective owners, and any references here are made solely for identification or informational purposes, without implying any affiliation, endorsement, or partnership.
We make no representations or warranties, express or implied, regarding the accuracy, completeness, or suitability of any content or products presented. Nothing on this website should be construed as legal, tax, investment, financial, medical, or other professional advice. In addition, no part of this site—including articles or product references—constitutes a solicitation, recommendation, endorsement, advertisement, or offer to buy or sell any securities, franchises, or other financial instruments, particularly in jurisdictions where such activity would be unlawful.
All content is of a general nature and may not address the specific circumstances of any individual or entity. It is not a substitute for professional advice or services. Any actions you take based on the information provided here are strictly at your own risk. You accept full responsibility for any decisions or outcomes arising from your use of this website and agree to release us from any liability in connection with your use of, or reliance upon, the content or products found herein.