
|
تقييم ماركوس (MCS) DCF |
Fully Editable: Tailor To Your Needs In Excel Or Sheets
Professional Design: Trusted, Industry-Standard Templates
Investor-Approved Valuation Models
MAC/PC Compatible, Fully Unlocked
No Expertise Is Needed; Easy To Follow
The Marcus Corporation (MCS) Bundle
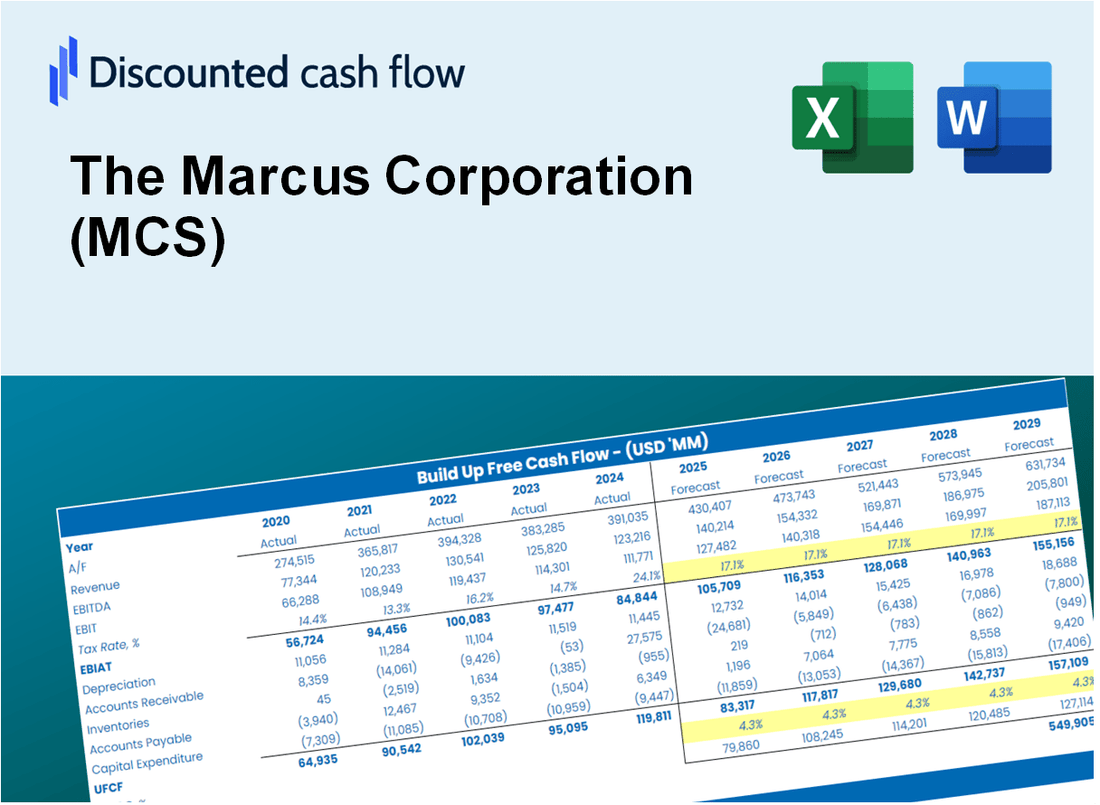
قم بتقييم آفاق ماركوس (MCS) المالية لشركة Marcus Corporation مثل الخبير! توفر حاسبة DCF (MCS) هذه البيانات المالية المليئة مسبقًا وتوفر مرونة تامة لتعديل نمو الإيرادات و WACC والهوامش والافتراضات الأساسية الأخرى التي تتماشى مع تنبؤاتك.
What You Will Receive
- Customizable Excel Template: A fully adjustable Excel-based DCF Calculator featuring pre-filled real MCS financials.
- Authentic Data: Historical figures and future projections (highlighted in the yellow cells).
- Forecast Adaptability: Modify forecast parameters such as revenue growth, EBITDA %, and WACC.
- Instant Calculations: Quickly observe how your inputs affect Marcus Corporation’s valuation.
- Professional Resource: Designed for investors, CFOs, consultants, and financial analysts.
- Intuitive Layout: Organized for clarity and simplicity, complete with step-by-step guidance.
Key Features
- Accurate Marcus Financials: Gain access to reliable pre-loaded historical data and future forecasts.
- Adjustable Forecast Parameters: Modify yellow-highlighted cells such as WACC, growth rates, and profit margins.
- Real-Time Calculations: Instant updates to DCF, Net Present Value (NPV), and cash flow assessments.
- Intuitive Visual Dashboard: User-friendly charts and summaries to help you visualize your valuation outcomes.
- Designed for All Users: A straightforward, intuitive layout tailored for investors, CFOs, and consultants alike.
How It Works
- 1. Access the Template: Download and open the Excel file containing The Marcus Corporation's (MCS) preloaded data.
- 2. Adjust Assumptions: Modify key inputs such as growth rates, WACC, and capital expenditures to fit your analysis.
- 3. Instant Results: The DCF model automatically calculates the intrinsic value and NPV for The Marcus Corporation (MCS).
- 4. Explore Scenarios: Evaluate multiple forecasts to assess various valuation outcomes for The Marcus Corporation (MCS).
- 5. Present with Assurance: Deliver professional valuation insights to enhance your decision-making regarding The Marcus Corporation (MCS).
Why Choose This Calculator for The Marcus Corporation (MCS)?
- User-Friendly Interface: Perfectly crafted for both novices and seasoned users.
- Customizable Inputs: Effortlessly adjust parameters to suit your analysis needs.
- Real-Time Feedback: Instantly observe changes in The Marcus Corporation’s valuation as you modify inputs.
- Pre-Configured Data: Comes with The Marcus Corporation’s actual financial metrics for swift evaluations.
- Relied Upon by Experts: Employed by investors and analysts for making well-informed choices.
Who Should Use The Marcus Corporation (MCS)?
- Investors: Gain insights into a leading hospitality and entertainment company to make informed investment choices.
- Financial Analysts: Utilize comprehensive financial reports and performance metrics to streamline your analysis.
- Consultants: Easily customize presentations or reports using data from a reputable industry player.
- Finance Enthusiasts: Explore the dynamics of the hospitality sector and enhance your understanding of market trends.
- Educators and Students: Leverage real-world case studies from The Marcus Corporation (MCS) in finance and business courses.
What the Template Contains
- Pre-Filled DCF Model: The Marcus Corporation’s financial data preloaded for immediate use.
- WACC Calculator: Detailed calculations for Weighted Average Cost of Capital.
- Financial Ratios: Evaluate The Marcus Corporation’s profitability, leverage, and efficiency.
- Editable Inputs: Change assumptions such as growth, margins, and CAPEX to fit your scenarios.
- Financial Statements: Annual and quarterly reports to support detailed analysis.
- Interactive Dashboard: Easily visualize key valuation metrics and results.
Disclaimer
All information, articles, and product details provided on this website are for general informational and educational purposes only. We do not claim any ownership over, nor do we intend to infringe upon, any trademarks, copyrights, logos, brand names, or other intellectual property mentioned or depicted on this site. Such intellectual property remains the property of its respective owners, and any references here are made solely for identification or informational purposes, without implying any affiliation, endorsement, or partnership.
We make no representations or warranties, express or implied, regarding the accuracy, completeness, or suitability of any content or products presented. Nothing on this website should be construed as legal, tax, investment, financial, medical, or other professional advice. In addition, no part of this site—including articles or product references—constitutes a solicitation, recommendation, endorsement, advertisement, or offer to buy or sell any securities, franchises, or other financial instruments, particularly in jurisdictions where such activity would be unlawful.
All content is of a general nature and may not address the specific circumstances of any individual or entity. It is not a substitute for professional advice or services. Any actions you take based on the information provided here are strictly at your own risk. You accept full responsibility for any decisions or outcomes arising from your use of this website and agree to release us from any liability in connection with your use of, or reliance upon, the content or products found herein.